


UK Home Building to Fall - Iimplications for House Prices
Housing-Market / UK Housing Jul 02, 2014 - 05:56 AM GMTBy: Nadeem_Walayat

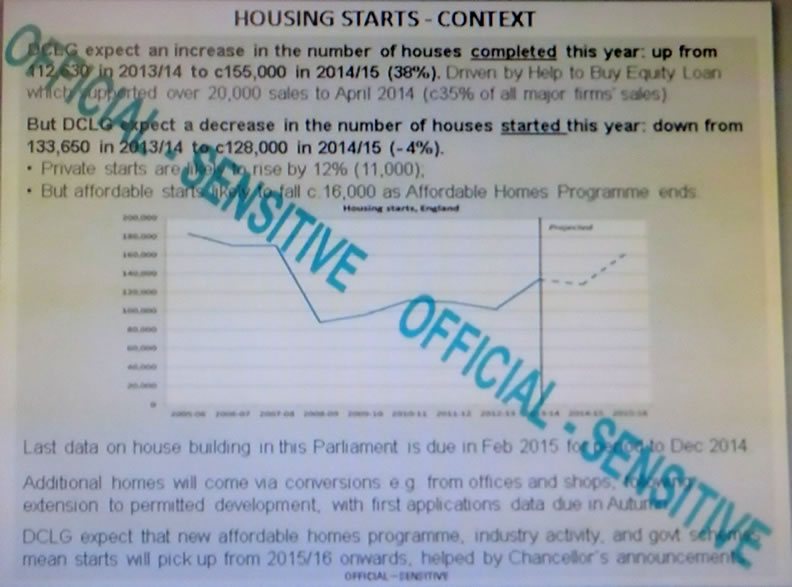
 Leaked government documents have fallen into the hands of BBC Newsnight that show that despite all of the extreme measures to date to stoke up house building such as the help to buy scheme, instead the accelerating trend for house building looks set to come to an abrupt halt in the lead up to the next general election as the number of homes built for 2014-15 is now expected to fall by 4% to 128,000 from 133,650 for 2013-14.
However, contrary to the apparent story of a surprise drop in house building that the likes of Newsnight and much of the rest of the mainstream press will be running with over the coming days. Instead, I suspect that the fall in house building is probably by design as the consquences for a small drop will be to further stoke up house prices in the lead up to the next general election as the only way to get house prices to fall would be to build a lot more houses, and I mean a lot more, more then DOUBLE the existing number per year. For instance to have any real impact on halting the run away house prices mega-trend requires at least 250,000 new homes to be built each year just to stand still in terms of new supply to meet the annual new demand and probably nearer to 300,000 to actually put house prices into reverse gear which is just not going to happen.
So who benefits form the fall in house building during election year?
I suspect it is Labour councils putting the brakes on building social housing as it is well within their means to effect the building of 10,000 or so of new homes. Whilst a few thousand extra homes would not effect housing market sentiment but politically a fall in the number of new builds compared to the preceding year would play into Labour party election propaganda.
The UK Housing Market ebook (FREE DOWNLOAD) explains at length the multiple dynamics involved that drive house prices ever higher, towards of which new house building is one of the key determinents for the house prices trend for the whole of the remainder of this decade as excerpted below -
UK House Building and Population Growth
The below graph shows the UK annual population change against annual new housing build completions.
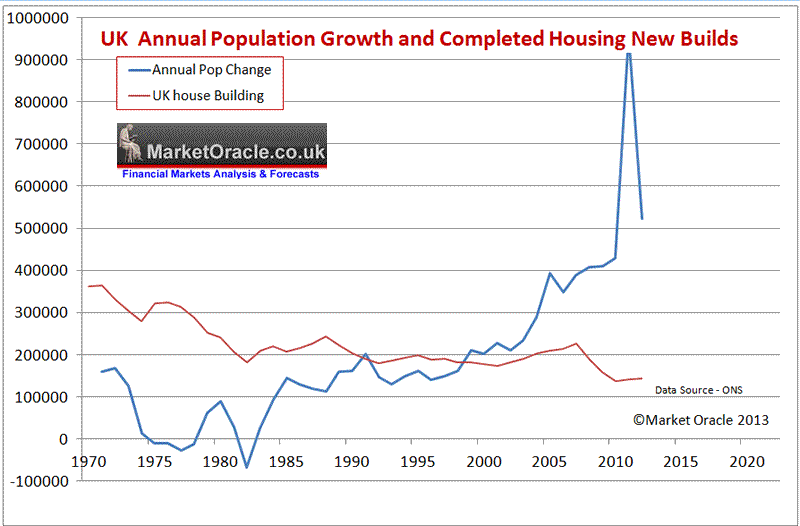
The graph illustrates a major long-term shift took place in the UK housing market dynamics by 2000 when the annual increase in population started to far exceed the number of new builds that ended the preceding trend for construction to exceed population growth in terms of addressing the UK's chronic long standing housing shortage, especially considering that the average size of households has continued to shrink falling from 3.1 in 1960 to just 2.25 in 2013 (one of the lowest in the world) as a consequence of the increase in single person households and single parent families. Therefore instead of increasing house building during the immigration catastrophe the exact opposite has taken place as far fewer houses were built each year than during the preceding decade This ratio is only trending in one direction i.e. lower which means that even if the UK population suddenly stopped increasing then the falling ratio towards 2.15 by 2030 would imply demand for an EXTRA 1.25 million properties.
The below graph further illustrates the ratio between the accumulative change in population since 1970 against the accumulative number of new housing builds also since 1970 as a ratio that shows the level of UK over crowding.
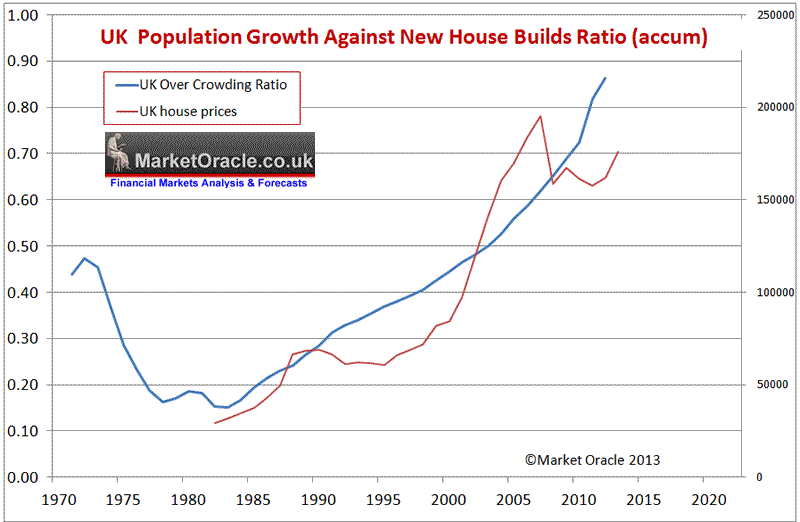
This better illustrates the change in trend that started to take place during the mid 1980's that coincided with the Thatcher governments reversal of the policy for the construction of social housing and implementation of the right to buy programme that resulted in the sale of millions of socially owned local council housing that ignited the property boom of the nineties AND noughties, the trend that was set in motion was for the inability of supply to keep pace with population growth which ensured continuously persistent upward pressure on house prices that despite the great recession still showed an accelerating trend as new build supply that currently stands at an estimated 140k per year is set against government estimates for a requirement of at least 250k per year, with 300k a more realistic estimate when the trend for a falling household size is taken into account, which thus ensures that the UK's over crowding situation is expected to continue to worsen year on year going forward, especially if the size of average households continues to shrink which would require 70,000 new builds per year even if the population stopped increasing.
And this analysis does not even consider the fact that each year the total number of properties remaining empty continues to rise either as a consequence of being for sale, let, legal issues or falling derelict. This totals now more than 1 million empty properties at any one time, a number which despite demand looks set to continue to rise as many of the derelict buildings will only come back on the market when they have been demolished and rebuilt, so erroneously counted as new builds when they should be classed as rebuilds.
Implications for House Prices
New build supply plays an important role in the housing market as it tends to average at approx 10% of the total number of annual transactions, which is more than enough to have a significant effect on the UK housing market especially as supply over recent decades has been consistently below that which is deemed necessary to meet the demands of a growing population which meant that the UK housing market was never destined to replicate the housing busts of countries such as the United States or even closer to home of countries such as Spain, where that housing bust has prompted many hundreds of thousands of British ex-pats to cut their losses and return to the UK, closely followed by unemployed Spanish and other PIIGS citizens seeking employment in a far more liberal and robust UK jobs market and thus introduce new demand into the UK housing market.
This suggests that the often put forward academic standards in terms of valuing the housing market affordability ratios such as X3.5 salary towards the likely path for the UK house prices does not take into account that of new demand against new supply trend that implies affordability ratios look set to be pushed ever higher to new trend extremes, and therefore supporting long-term rising price trends for UK house prices in real terms, i.e. expensive UK house prices look set to be here to stay for as long as the lack of new supply exists, especially as the UK population is expected to grow by at least another 5 million over the next 10 years and probably nearer 6 million which demands at least an extra 2.5 million homes to be built which is set against an realistic estimated construction of just 1.4 million new homes, which means UK over crowding is going to continue to get much worse and thus drive house prices ever higher.
The bottom line is Britain's over crowding ratio insures that no matter what the arguments are put forward by academics that many people just cannot afford to buy so house price rises must be unsustainable, instead the population growth fundamentals are such that their argument just does not matter, the only thing that can effect this fundamental trend is if the UK literally doubled the number of houses built per year, and even then it would not result in a fall in house prices but tend to index house prices to inflation. But off course that is not going to happen, the UK is not going to build anywhere near 300,000 homes per year, as the reality is that for most years UK house building will be short by as much as 150,000 completed new builds each year which will just compound the housing market demand vs supply pressures and thus exert further upward pressure on house prices.
UK House Prices Five Year Forecast
The latest reports of expectations for a fall in UK house building reinforces the house prices mega-trend forecast for a 55% rise in house prices over 5 year period into the end of 2018 as illustrated below -
UK House Prices Forecast 2014 to 2018 - Conclusion
This forecast is based on the non seasonally adjusted Halifax House prices index that I have been tracking for over 25 years. The current house prices index for November 2013 is 174,671, with the starting point for the house prices forecast being my interim forecast as of July 2013 and its existing trend forecast into Mid 2014 of 187,000. Therefore this house prices forecast seeks to extend the existing forecast from Mid 2014 into the end of 2018 i.e. for 5 full years forward.
My concluding UK house prices forecast is for the Halifax NSA house prices index to target a trend to an average price of £270,600 by the end of 2018 which represents a 55% price rise on the most recent Halifax house prices data £174,671, that will make the the great bear market of 2008-2009 appear as a mere blip on the charts as the following forecast trend trajectory chart illustrates:
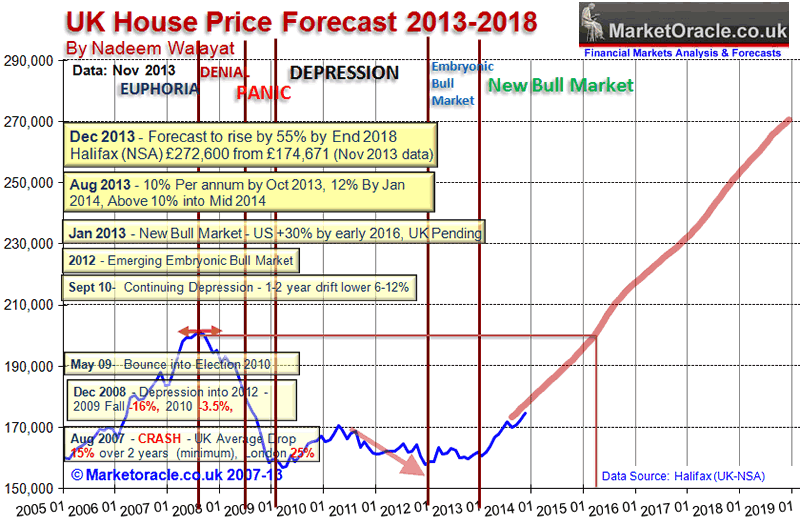
Current State of the UK House Prices Forecast
The updated graph reflects the latest Halifax house prices data (NSA) released for May 2014 at £185,747 which is set against the forecast index level for May 2014 of £185,544 which illustrates that house prices over the past 6 months have shown little deviation from the forecast trend and therefore the long-term trend forecast remains on track to achieve a 55% increase by the end of 2018.
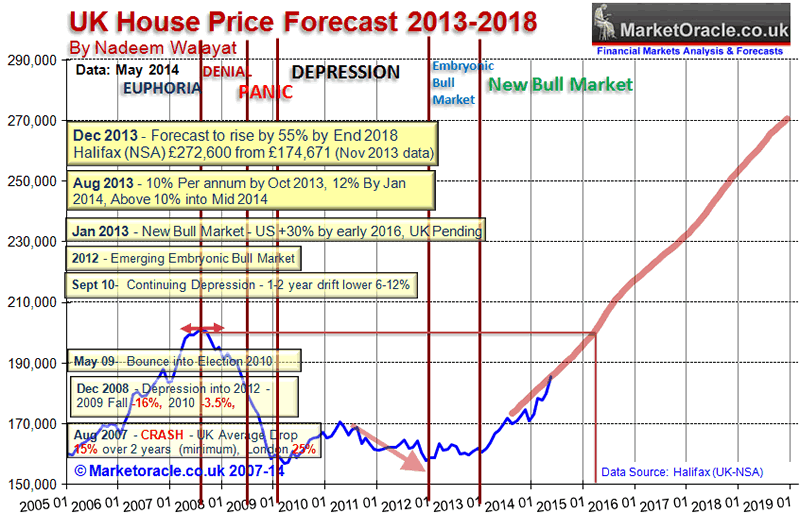
As house prices momentum is accelerating this suggests that UK house prices could trend slightly above the forecast trend trajectory over the summer months.
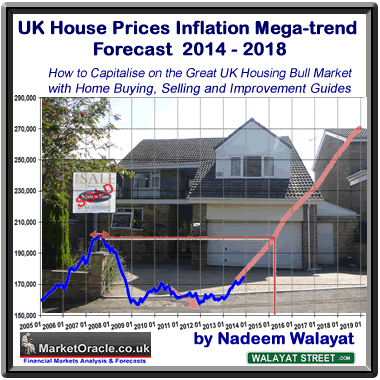 UK Housing Market Forecast 2014-2018 Ebook - FREE DOWNLOAD
The housing market ebook of over 300 pages comprises four main parts :
1. U.S. Housing Market Analysis and Trend Forecast 2013-2016 - 27 pages
The US housing market analysis and concluding trend forecast at the start of 2013 acted as a good lead exercise for the subsequent more in-depth analysis of the UK housing market.
2. U.K. Housing Market Analysis and House Prices Forecast 2014-2018 - 107 pages
The second part comprises the bulk of analysis that concludes in several detailed trend forecasts including that for UK house prices from 2014 to 2018 and their implications for the outcome of the next General Election (May 2015) as well as the Scottish Referendum.
3. Housing Market Guides - 138 Pages
Over 1/3rd of the ebook comprises of extensive guides that cover virtually every aspect of the process of buying, selling and owning properties, including many value increasing home improvements continuing on in how to save on running and repair costs with timely maintenance tasks and even guides on which value losing home improvements should be avoided.
- What Can You Afford to Buy?
- Home Buyers Guide
- Home Sellers Guide
- Top 15 Value Increasing Home Improvements
- Home Improvements to Avoid
- Home Winter Weather Proofing 22 Point Survey
These guides will further be supplemented from Mid 2014 onwards by a series of online videos and regularly updated calculators such as the Home Buying Profit and Loss Calculator, which will seek to give calculations on whether to buy or rent based on personal individual circumstances, that will be updated to include the latest expected trend trajectories for future house price inflation i.e. you will have your own personal house price forecast.
4. Historic Analysis 2007 to 2012 - 40 pages
A selection of 10 historic articles of analysis to illustrate the process of analysis during key stages of the housing markets trend from the euphoric bubble high, to a state of denial as house prices entered a literal free fall, to the depths of depression and then emergence of the embryonic bull market during 2012 that gave birth to the bull market proper of 2013.
FREE DOWNLOAD (Only requirement is a valid email address)
Source and comments: http://www.marketoracle.co.uk/Article46284.html
By Nadeem Walayat
Copyright © 2005-2014 Marketoracle.co.uk (Market Oracle Ltd). All rights reserved.
Nadeem Walayat has over 25 years experience of trading derivatives, portfolio management and analysing the financial markets, including one of few who both anticipated and Beat the 1987 Crash. Nadeem's forward looking analysis focuses on UK inflation, economy, interest rates and housing market. He is the author of five ebook's in the The Inflation Mega-Trend and Stocks Stealth Bull Market series that can be downloaded for Free.


 Nadeem is the Editor of The Market Oracle, a FREE Daily Financial Markets Analysis & Forecasting online publication that presents in-depth analysis from over 1000 experienced analysts on a range of views of the probable direction of the financial markets, thus enabling our readers to arrive at an informed opinion on future market direction. http://www.marketoracle.co.uk
Disclaimer: The above is a matter of opinion provided for general information purposes only and is not intended as investment advice. Information and analysis above are derived from sources and utilising methods believed to be reliable, but we cannot accept responsibility for any trading losses you may incur as a result of this analysis. Individuals should consult with their personal financial advisors before engaging in any trading activities.
Nadeem Walayat Archive |
© 2005-2022 http://www.MarketOracle.co.uk - The Market Oracle is a FREE Daily Financial Markets Analysis & Forecasting online publication.