


Stock Market Primary III Wave Continues
Stock-Markets / Stock Markets 2014 Jul 06, 2014 - 12:49 PM GMTBy: Tony_Caldaro

 The holiday shortened week started on Monday with new bull markets highs, and continued making higher highs nearly every day this week. For the week the SPX/DOW were +1.3%, the NDX/NAZ were +1.3%, and the DJ World index gained 1.4%. Economic reports for the week were mixed. But the big news was the 288k jump in payrolls and the decline in the unemployment rate to 6.1%. On the uptick: pending home sales, construction spending, the ADP index and the Trade deficit improved. On the downtick: the Chicago PMI, factory orders, ISM manufacturing/services, and weekly jobless claims rose. Next week we get reports on Consumer credit, the Treasury deficit, and the FOMC minutes.
LONG TERM: bull market
Prior to 2013 the all time record for the SPX was the 2007 high at 1576. This week the SPX hit 1986: 26% above that high. And the market is now 198% above the great recession low at SPX 667. This market has nearly tripled in just over five years. During the same five year span: 10 year bonds have yielded between 1.39% and 4.01%, money market funds even less, while the FED has quintupled the money supply from $800bn to $4tn. Yet the GDP raw data as only increased 19.2% ($14.342tn to $17.090tn). We certainly live in extraordinary times.
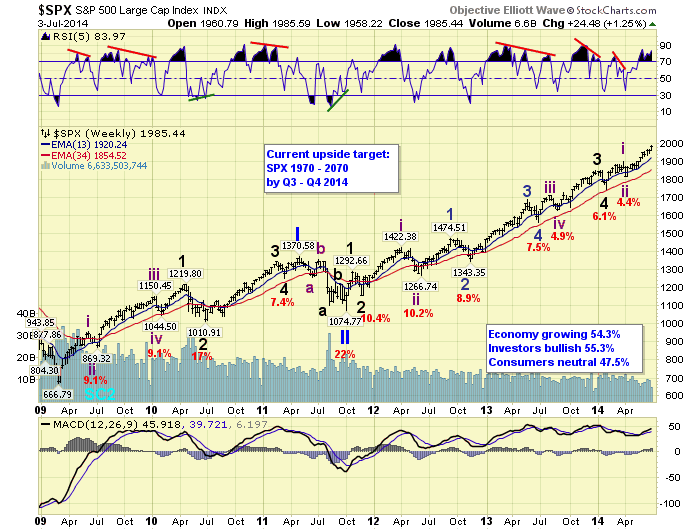
We continue to count this bull market as Cycle wave [1] of the new multi-generational Super cycle 3. Cycle wave bull markets unfold in five Primary waves. Primary waves I and II completed in 2011, and Primary III continues to unfold. When it does conclude we should have a Primary IV correction similar to Primary II in 2011. Then Primary V should again take the market to all time new highs. A four year Presidential cycle low is due this year, which usually creates the low for the year. The majority of the time they occur in July or October. Since the market still needs an a downtrend (Int. iv), then an uptrend (Int. v), to complete Primary III. It looks like the four year low will occur in the fourth quarter.
MEDIUM TERM: uptrend
The current Intermediate wave iii uptrend has been unfolding since the mid April Int. wave ii low of SPX 1814. For the first several weeks of this uptrend few imagined we would be making new highs. Yet here we are, nearly 90 points above the April SPX 1897 high. We have been counting this uptrend with five Minor waves: Minor 1 @1885, Minor 2 @1851, Minor 3 @1968, and recently Minor 4 @1945. Minor wave 5 has been underway since that low.
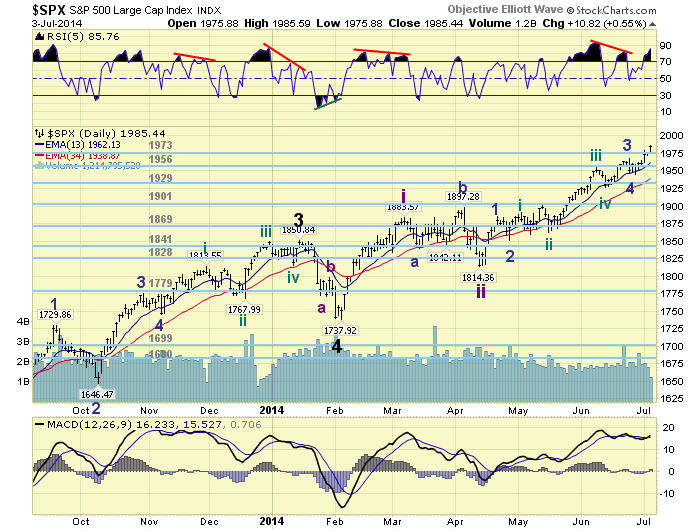
When the uptrend began we had targeted the OEW 1956 and 1973 pivots as likely uptrend highs, with an outside chance for the 2019 pivot. The 1956 pivot was hit during Minor 3, the 1973 pivot put the top in Minor 3, now Minor wave 5 just cleared that pivot and appears heading to the 2019 pivot. At the 2019 pivot Minor 5 would equal Minor 1 and 0.618 Minor 3. Yet there appears to be two important resistance levels before this can occur: @SPX 1989 Minor 5 equals 0.618 Minor 1, and of course @SPX 2000. Medium term support is at the 1973 and 1956 pivots, with resistance at the 2019 and 2070 pivots.
SHORT TERM
Short term support is at the 1973 and 1956 pivots, with resistance at SPX 1989 and the 2019 pivot. Short term momentum ended the week extremely overbought. The short term OEW charts remain positive with the reversal level now SPX 1977.
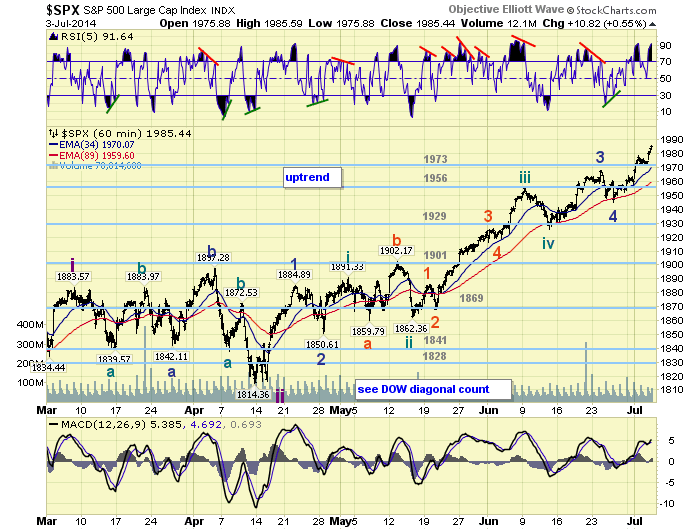
When Minor wave 5 began we were not quite sure Minor 4 had completed. It was only two days and the decline was only 23 points. However, when the market hit SPX 1968 again on Tuesday it was quite clear Minor wave 5 was underway. Ever since this rally began, a week ago Thursday, the pullbacks have been quite small. We have currently risen 41 points without a meaningful pullback. This type of uninterrupted thrust has not occurred, in this uptrend, since Minor wave 1 (69 points) and the exact center of Minor wave 3 (57 points).
If we consider the three small pullbacks we do arrive with an OEW pattern: 1958-1952-1964-1958-1979-1973-1986. SPX 1958 and 1952 would be the first and second waves, then a five wave sequence to the current SPX 1986 high. This pattern would suggest there is one more small pullback then new highs before this rally ends. Something to keep in mind in the upcoming week. Best to your trading.
FOREIGN MARKETS
The Asian markets were all higher this week for a net gain of 1.5%.
The European markets were all higher as well for a gain of 1.4%.
The Commodity equity group were also all higher gaining 1.1%.
The DJ World index continues to uptrend and gained 1.4%.
COMMODITIES
Bonds remain in a downtrend and lost 0.9% on the week.
Crude has been struggling of late losing 1.6% for the week.
Gold is still uptrending gaining 0.3% on the week.
The USD bounced around this week gaining 0.2%.
NEXT WEEK
Tuesday: Consumer credit at 3pm. Wednesday: the FOMC minutes. Thursday: weekly Jobless claims and Wholesale inventories. Friday: the Treasury deficit. Vice chair Fischer gives his first speech on Thursday right after the close at 4:30. Best to your three day weekend and week!
CHARTS: http://stockcharts.com/public/1269446/tenpp
http://caldaroew.spaces.live.com
After about 40 years of investing in the markets one learns that the markets are constantly changing, not only in price, but in what drives the markets. In the 1960s, the Nifty Fifty were the leaders of the stock market. In the 1970s, stock selection using Technical Analysis was important, as the market stayed with a trading range for the entire decade. In the 1980s, the market finally broke out of it doldrums, as the DOW broke through 1100 in 1982, and launched the greatest bull market on record.
Sharing is an important aspect of a life. Over 100 people have joined our group, from all walks of life, covering twenty three countries across the globe. It's been the most fun I have ever had in the market. Sharing uncommon knowledge, with investors. In hope of aiding them in finding their financial independence.
Copyright © 2014 Tony Caldaro - All Rights Reserved Disclaimer: The above is a matter of opinion provided for general information purposes only and is not intended as investment advice. Information and analysis above are derived from sources and utilising methods believed to be reliable, but we cannot accept responsibility for any losses you may incur as a result of this analysis. Individuals should consult with their personal financial advisors.
Tony Caldaro Archive |
© 2005-2022 http://www.MarketOracle.co.uk - The Market Oracle is a FREE Daily Financial Markets Analysis & Forecasting online publication.