


Crude Oil Price Time for Recovery?
Commodities / Crude Oil Jul 11, 2014 - 04:20 PM GMTBy: Nadia_Simmons

 On Thursday, crude oil gained 0.94% as profit taking and upbeat U.S. jobless claims data supported the price. As a result, the commodity bounced off a very important support zone and came back above $102 per barrel. Does it mean that the bottom of the recent correction is in?
Although crude oil hit a 2-month low of $101.55, declining to slightly below the June low, the commodity reversed and rebounded as traders who had bet on falling prices made purchases yesterday to close those positions.
Additionally, upbeat U.S. jobless claims numbers supported oil as well. Yesterday, the U.S. Department of Labor reported that the number of individuals filing for initial jobless benefits in the week ending July 5 declined by 11,000 to 304,000, while analysts had expected jobless claims to hold steady at 315,000 last week.
As we mentioned earlier, because of these circumstances, light crude rebounded and came back above $102. Did this upswing change the technical picture of the commodity? Let’s check charts below (charts courtesy of http://stockcharts.com).
In our commentary posted on July 7 (and cited in the following days), we wrote:
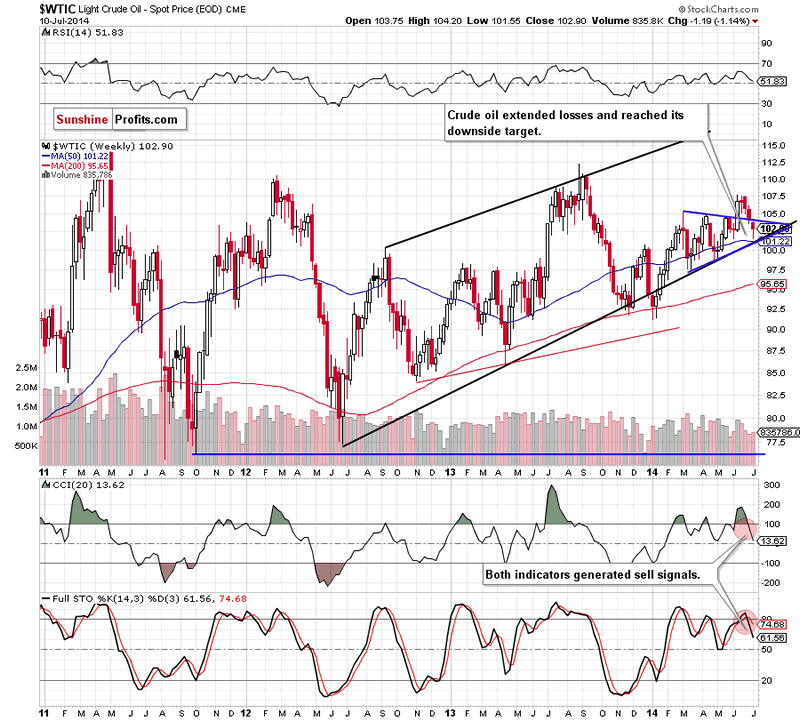
(…) crude oil will extend the current correction and the initial downside target will be around $101.60, where the June low is. At this point it’s worth noting that slightly below this level is a strong support zone created by the 50-week moving average (currently at $101.26) and the lower line of the trend channel (and lower border of the blue triangle), which may pause further deterioraion.
As you see on the weekly chart, the situation developed in line with the above-mentioned scenario and crude oil tested the strength of the support zone. So far, it withstand the selling pressure, which resulted in a small (compared to the entire decline) corrective upswing. Although sell signals generated by the indicators remain in place, favoring oil bears, it’s quite possible that the medium-term support encourage oil bulls to not give up and we’ll see further improvement in the coming days. How high could light crude go? Let’s check the very short-term picture and find out where the nearest important resistance levels are.
Quoting our last Oil Trading Alert:
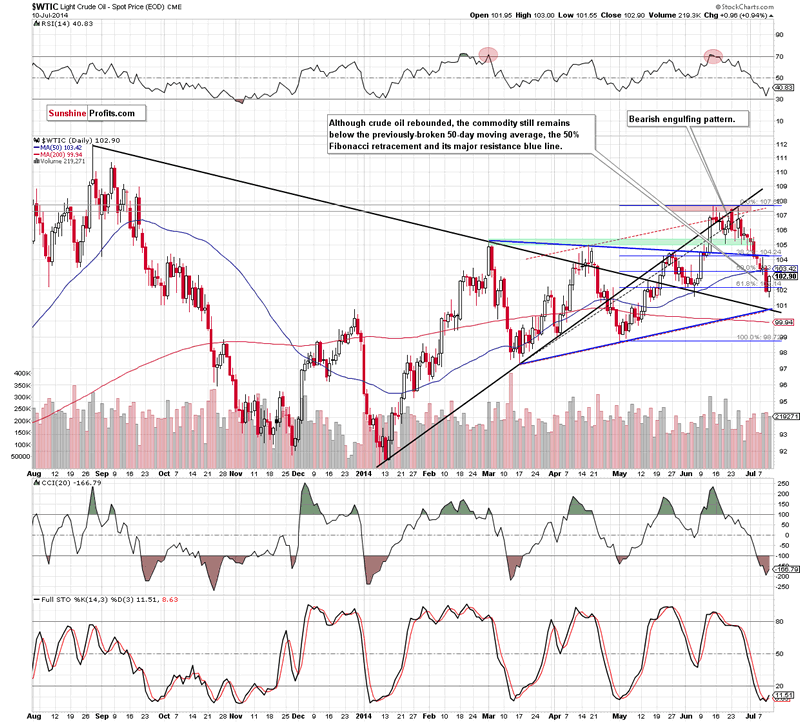
(…) In our opinion, the very short-term technical situation has changed from bearish to even more bearish as Tuesday’s upswing was nothing more than a verification of the breakdown. Therefore, it’s doubtful to us that we’ll see a rebound before a drop to (at least) $101.60, where the June low and the medium-term downside targets are. Please remember that you should keep an eye on the commodity in this area, because, as we have pointed out before, this support zone may pause further deterioration.
Yesterday, oil bears realized their scenario once again and crude oil tested the June low. As you see on the daily chart, this key level in combination with the proximity to the medium-term support zone triggered a corrective move, which took the commodity above the previously-broken 61.8% Fibonacci retracement. Although this is a bullish signal, the size of the upswing is too small to say that the very short-term picture has improved significantly. At this point it’s worth noting that the commodity didn’t even erase 23.6% of the recent declines, not to mention the invalidation of the breakdown below the blue resistance line. Nevertheless, taking into account the above-mentioned strong support zone and the fact that the CCI and Stochastic Oscillator are oversold, further improvement and a try to come back above the nearest resistance zone (created by the 50-day moving average and the previously-broken 50% Fibonacci retracement) should not surprise us. In our opinion, if it is broken, the commodity will likely increase to around $104, where the blue resistance line is. However, if oil bulls fail and light crude moves lower from here, we’ll see another test of the strength of the June low and the medium-term support zone.
Summing up, the highlight of yesterday’s session was a realization of the bearish scenario that we discussed at the beginning of the week. As a result, crude oil declined
to its downside target and, accordance with our yesterday’s assumptions, rebounded from that area. Does it mean that the final bottom of the recent correction is in? So far, we noticed only one-day rally, which didn’t change the short-term picture. Nevertheless, it’s quite likely that a local bottom is materializing right now as light crude reached the key support zone, which may translate to higher prices of crude oil. Therefore, we suggest closing short positions and taking profits off the table. Crude oil dropped quite nicely from $106.50 , which is the price at which we had suggested opening short positions on June 17, and it seems that cashing in the latest gains is appropriate.
Very short-term outlook: bearish
Short-term outlook: mixed with bearish bias
MT outlook: mixed
LT outlook: mixed
Trading position (short-term; our opinion): No positions are justified from the risk/reward perspective at the moment.
Thank you.
Nadia Simmons
Forex & Oil Trading Strategist
Przemyslaw Radomski
Founder, Editor-in-chief
Gold & Silver Trading Alerts
Forex Trading Alerts
Oil Investment Updates
Oil Trading Alerts
* * * * *
Disclaimer
All essays, research and information found above represent analyses and opinions of Nadia Simmons and Sunshine Profits' associates only. As such, it may prove wrong and be a subject to change without notice. Opinions and analyses were based on data available to authors of respective essays at the time of writing. Although the information provided above is based on careful research and sources that are believed to be accurate, Nadia Simmons and his associates do not guarantee the accuracy or thoroughness of the data or information reported. The opinions published above are neither an offer nor a recommendation to purchase or sell any securities. Nadia Simmons is not a Registered Securities Advisor. By reading Nadia Simmons’ reports you fully agree that he will not be held responsible or liable for any decisions you make regarding any information provided in these reports. Investing, trading and speculation in any financial markets may involve high risk of loss. Nadia Simmons, Sunshine Profits' employees and affiliates as well as members of their families may have a short or long position in any securities, including those mentioned in any of the reports or essays, and may make additional purchases and/or sales of those securities without notice.
© 2005-2022 http://www.MarketOracle.co.uk - The Market Oracle is a FREE Daily Financial Markets Analysis & Forecasting online publication.