


SPX Fibonacci Study
Stock-Markets / Stock Markets 2014 Aug 22, 2014 - 04:19 PM GMT

 I have done a Fibonacci study of the SPX and wish to share it with you.
· Minor Wave 1, which began at the June 24. 2013 low is 149.34 points in length.
· Minor Wave 3 is 223.37 points in length and 1.4957 times the size of Wave 1. Let’s call it a Fibonacci 1.50 times.
· So far, Minor Wave 5 is 256.84 points in length, or 1.72 times the size of Wave 1 (truly a blow-off top). In Fibonacci terms,
let’s make it a Fibonacci 1.786 times the size of Wave 1. That puts it at 2002.86. The Cycle Top resistance is at 2004.62, so it suggests that SPX may challenge its Cycle Top one more time before a reversal. Then again, it may not!
· In addition to the Cycle Top and Fib relationships, we also have round number resistance at 2000.00. The Dow has been fighting with round number resistance at 17000.00 since early July, so we know that it has the ability to repel as well as attract.
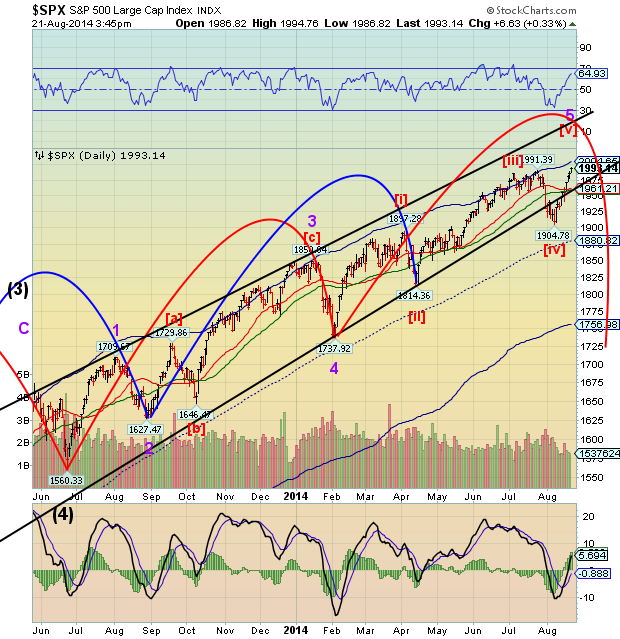
Time-wise, Minor Wave 1 only took two months. Wave 3 took 3 months. Wave 5 took 6.5 months. Again, we see extension in time and space.
At the Intermediate (Weekly) level, Wave (1) was 207.77 points in length. Wave (3) was 343.83 points, making it 1.65 times the size of Wave (1) and exceeding the Fibonacci 1.618 multiple. Wave (5) is 434.43 points in length. At 2.09 times the length of (1) it also exceeded its Fibonacci target. Wave (5) is also larger than the combined points in Waves (1) through (3) at 420.44 points. In a more “normal” wave structure, the entire rally may have been finished somewhere between the 14-year Top at about 1620 to possibly 1770.00, which was hit in September 2013. This is one of the aggravating things about this rally that was confounding.
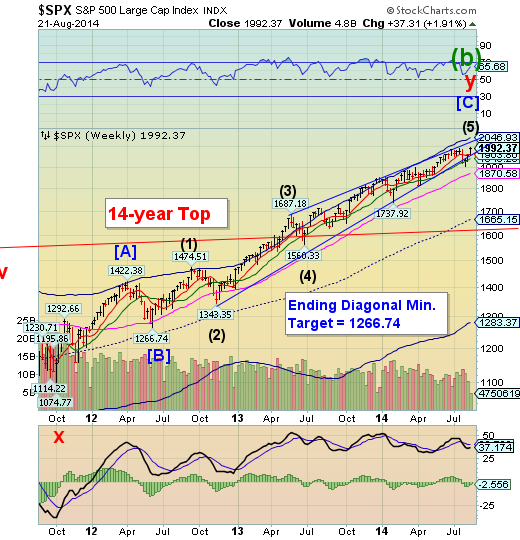
On the flip side, the minimum target of Intermediate Wave (1) or (A) that we should immediately see from the top should be 1560.33. These blow-offs unwind much faster than they are created, so let’s see what the next Panic Cycle brings us…
Regards,
Tony
Our Investment Advisor Registration is on the Web
We are in the process of updating our website at www.thepracticalinvestor.com to have more information on our services. Log on and click on Advisor Registration to get more details.
If you are a client or wish to become one, please make an appointment to discuss our investment strategies by calling Connie or Tony at (517) 699-1554, ext 10 or 11. Or e-mail us at tpi@thepracticalinvestor.com .
Anthony M. Cherniawski, President and CIO http://www.thepracticalinvestor.com
As a State Registered Investment Advisor, The Practical Investor (TPI) manages private client investment portfolios using a proprietary investment strategy created by Chief Investment Officer Tony Cherniawski. Throughout 2000-01, when many investors felt the pain of double digit market losses, TPI successfully navigated the choppy investment waters, creating a profit for our private investment clients. With a focus on preserving assets and capitalizing on opportunities, TPI clients benefited greatly from the TPI strategies, allowing them to stay on track with their life goals
Disclaimer: The content in this article is written for educational and informational purposes only. There is no offer or recommendation to buy or sell any security and no information contained here should be interpreted or construed as investment advice. Do you own due diligence as the information in this article is the opinion of Anthony M. Cherniawski and subject to change without notice.
Anthony M. Cherniawski Archive |
© 2005-2022 http://www.MarketOracle.co.uk - The Market Oracle is a FREE Daily Financial Markets Analysis & Forecasting online publication.