


Odds Favor Short-Term Crude Oil Downtrend
Commodities / Crude Oil May 15, 2008 - 01:56 PM GMTBy: Frank_Holmes

 Years ago when oil was $30 per barrel, we were laughed at when we suggested that it could trade over $100. Now it seems we were being a bit conservative.
That said, based on statistical tools we use to measure probabilities, we believe oil is currently overbought and due for a short-term correction of $20 to $35 before resuming a longer-term price climb that could well reach $200 per barrel.
The primary reason for the rising oil price is growing demand by China and India . Only a few decades ago, the planet's two most populous countries were both extremely poor and inward-looking. Today they represent about 40 percent of the world's population and their economies are growing at 10 percent a year. Both countries have embarked on long-term infrastructure spending and urbanization, and they are both of growing importance in the global economy.
This growth profile has led to a large increase in oil consumption. In the first quarter of 2008, China 's consumption of refined oil products rose 16.5 percent compared to a year earlier and crude oil imports were up 8 percent. And while India 's per-capita use remains very low, the sheer size of its population makes it one of the top five oil-consuming countries in the world and its imports are steadily increasing.
Let's try to put oil's risks and opportunities into context by using oscillators, which measure price volatility, to compare the patterns over long (20 years) and medium (five years) time periods. We use oscillators to track the movement of a stock or commodity through price and time to help identify overbought and oversold conditions based on the concept that prices move in waves. This allows us to use probabilities to manage risks and opportunities.
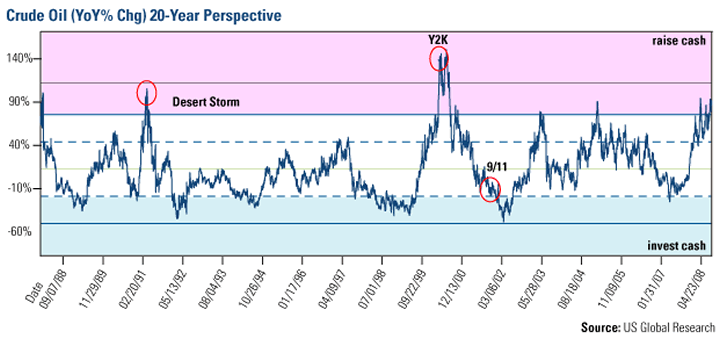
The oscillator above measures the year-over-year percentage variations using a rolling 60-day rate of change over a 20-year period. The dashed lines represent one standard deviation above and below the 20-year mean ($30.14 per barrel, the light green line), and each solid line outside the dashed lines marks an additional standard deviation.
When oil price changes get up into the pink area, which is where we find ourselves now, the statistical signal is that it is overbought because such rapid price increases occur less than 5 percent of the time and the odds strongly favor a reversal. Following the same logic, when the trend line dips down into the blue zone, the statistics suggest that it is oversold and thus a buying opportunity.
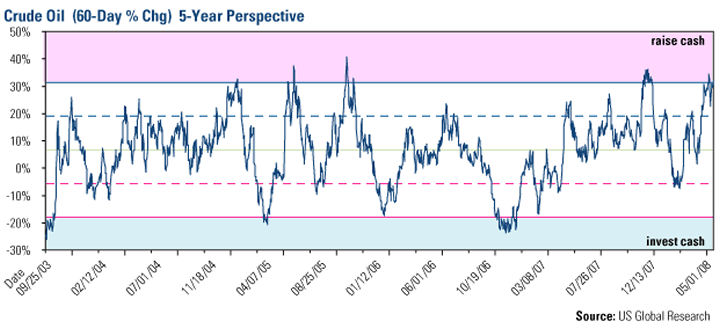
The same trend signal emerges when looking at a shorter time period, as we see above in the five-year oscillator. Over that span, the average price (light green line) is $58.56 per barrel. The 60-day rate change currently shows oil to also be in the pink “overbought” zone that statistically favors a short-term price reversal.
Of course, the statistical trend can be trumped by unexpected or orchestrated events, as we're now seeing in the Middle East . Hezbollah fighters have taken over parts of Beirut in what many Arabs in the region are calling a coup attempt against the pro-U.S. Lebanese government that's being directed by the Shiite nations of Iran and Syria . The uncertainties created by this fighting have put upward pressure on oil prices – this benefits Iran , whose government appears intent on building a currency surplus to fund disruption in the Middle East . Any counteraction against Iran by the U.S. or Israeli military, while unlikely at this point, could trigger a straight-up move in oil prices.
It's important to keep in mind that the oscillator is simply a statistical tool, and seldom would we sell 100 percent of any position based on what it tells us. However, when overlapped with fundamental analysis, the oscillator can help an active investor make better decisions on whether to be buyers or to take partial profits off the table at any particular point in time.
We are focused on the most undervalued energy plays based on cash-flow multiples, dividend yields and potential to substantially grow reserves per share in this environment. We note that the universe of stocks that fit this model has declined, so investors need to be very selective.
By Frank Holmes, CEO , U.S. Global Investors
More timely commentary from Frank Holmes is available in his investment blog, “Frank Talk”: www.usfunds.com/franktalk .
Please consider carefully the fund's investment objectives, risks, charges and expenses. For this and other important information, obtain a fund prospectus by visiting www.usfunds.com or by calling 1-800-US-FUNDS (1-800-873-8637). Read it carefully before investing. Distributed by U.S. Global Brokerage, Inc.
All opinions expressed and data provided are subject to change without notice. Some of these opinions may not be appropriate to every investor. Gold funds may be susceptible to adverse economic, political or regulatory developments due to concentrating in a single theme. The price of gold is subject to substantial price fluctuations over short periods of time and may be affected by unpredicted international monetary and political policies. We suggest investing no more than 5% to 10% of your portfolio in gold or gold stocks. The following securities mentioned in the article were held by one or more of U.S. Global Investors family of funds as of 12-31-07 : streetTRACKS Gold Trust.
Frank Holmes Archive |
© 2005-2022 http://www.MarketOracle.co.uk - The Market Oracle is a FREE Daily Financial Markets Analysis & Forecasting online publication.