


Government Inflation Data Does Not Match Reality
Economics / Inflation May 15, 2008 - 05:57 PM GMTBy: Gary_Dorsch

 In an age where governments of every political stripe distort economic data to promote their own self-interests, it's hardly surprising that they present inflation statistics that are wildly at odds with the reality faced by consumers and businesses, and regarded with utter disbelief. In the latest US government report on inflation for instance, there was a glaring “seasonal adjustment,” for energy prices that cast great doubt as to the accuracy of the findings.
US Labor Dept apparatchniks said consumer prices rose a smaller than expected 0.2% in April, tamed by energy prices, which were unchanged last month. Utilizing an obscure “seasonal adjustment,” Labor figured that gasoline prices actually fell 2% in April, which doesn't reflect the reality of what consumers were paying at the pump. Furthermore, the IMF's global food price index rose 43% over the last 12-months, but the US consumer price index for food is only 5.1% higher.
Wall Street cheered the tame inflation rate, reckoning it gives the Federal Reserve more time to peg the fed funds rate at 2%, to jig-up the stock market with massive money injections. But the folks who aren't fooled by the government's propaganda on inflation are the American people, whose dollars buy less with each passing month. The inflation tax is the great thief of the middle class.
For the 12-months through April, prices for US imports were 15.4% higher. Yet Wall Street economists massaged the data, and explained that wholesalers and retailers are absorbing the higher costs out of reluctance to increasing prices and driving away customers. Should we trust the inflation statistics conjured-up by government apparatchniks, or rather, place greater faith in the depreciating dollars and cents that flow through the commodity markets each business-day?
.gif)
According to the chart above, unleaded gasoline futures traded on the Nymex ended +12.2% higher in April, at $2.93 /gallon. The US Energy Information Administration (EIA), said average retail gas prices actually shot up 9.5% in April from March. Less than two weeks later, gasoline futures advanced another 10% to a record $3.22 /gallon, and retail prices are closing in on $4 /gallon nationwide.
On May 14th, upon hearing Labor's report of a scant 0.2% inflation rate during April, former Fed chief Paul Volcker had doubts about the way the government measures inflation. “It doesn't feel quite right. I think the bias clearly is more towards higher inflation, offset by the weakness of the domestic economy,” he said. “Seasonal adjustments” are just one of the useful tools that Labor apparatchniks have developed to fudge inflation statistics. The Bernanke Fed has a simpler model, it simply strips out food and energy costs, in its inflation calculus.
.gif)
Labor apparatchniks said retail food prices in April were +5.1% higher from a year ago. Yet, the Dow Jones Agricultural Commodity Index, which measures a basket of corn, coffee, cotton, soybeans, soybean oil, sugar, and wheat, was up 40% in April from a year earlier. Major central banks have greatly increased the levels of cash available to banks and brokers to stave off a credit crisis, and much of the excess money has found its way into agricultural and energy futures.
Also driving up food prices is bio-fuel production, which jumped 43% in the year through March. The American Farm Bureau Federation calculates that bio-fuel use accounts for up to 30% of the food price surge. About a third of the US corn crop, or 4-million bushels, is expected to go to making ethanol this year. The White House's chief economist, Ed Lazear said rising energy costs account for as much as 20% of rising food prices, while the sliding dollar accounts for about 13% of this increase.
Other factors supporting higher food prices are bad weather in traditionally big production areas, and tastes in Asia that are shifting toward greater consumption of proteins from meat and poultry which requires more grains to help produce.
.gif)
Not included in US inflation statistics is the Baltic Exchange's Sea Freight Index, which monitors the costs of shipping dry goods across 40 major trade routes for minerals, grains, cement and sugar. Earlier today, the key gauge of global economic activity jumped 4% to a record 11,067. Asian demand for grains and natural resources has not been dented by the global banking crisis or the economic recession in the United States. Freight shipping costs on key export routes are 75% higher than a year ago, and 1100% higher than seven years ago.
Bernanke Fed versus Volcker View of Inflation
The Fed's latest rate-cutting spree, taking the fed funds rate to 2% from 5.25% last September, has opened up the monetary floodgates, in order to jig-up the stock market, but also fueled a global commodity boom unlike anything witnessed since the 1970's. The weak US dollar is contributing to yet another speculative binge, this time in commodities, led by crude oil's surge to $127 a barrel this week.
The US M3 money supply is running +16.5% higher from a year ago, near its fastest rate of expansion in history, and far above the growth rate of the US economy. That's generating powerful inflationary pressures that are far outstripping wage increases. But on February 25th, a top Fed official Frederic Mishkin, defended the central bank's prevailing focus on “core inflation,” and stripping out food and energy costs, in order to keep the printing presses rolling at full speed.
“Stabilizing core inflation leads to better economic outcomes than stabilizing headline inflation. If central banks raise rates aggressively to counter inflation caused by a sudden rise in oil prices, unemployment will be markedly higher,” Mishkin warned. “The shock of energy price increases will likely wear-off and have only a temporary impact on inflation. When inflation expectations are well anchored, the central bank does not necessarily need to raise interest rates aggressively to keep inflation under control following an aggregate supply shock,” he argued.
But on May 14th, former Fed chief Volcker strongly disagreed, and warned the US economy could face a 1970's-style period of skyrocketing inflation, if consumers and investors lose confidence in the buying-power of the US dollar. “If there is a real loss of confidence in the dollar, then I think we are in trouble. That is something that has to be watched. That has to be very much in the forefront of our thinking, without that, we are back to the inflation of the 1970's or worse.”
.gif)
The Fed has already pumped half-a-trillion dollars into the financial system in the form of open market operations and its special emergency lending measures. Much of the excess cash in the financial system has not yet shown up in the economy, because the banks are afraid to lend the money. But once the credit crunch eases, the excess liquidity could not only expand bigger bubbles in the commodity markets, but also fuel hyper-inflation in the US economy, if not drained out quickly.
“If inflation gets too high, the economy will suffer dramatically,” warned Kansas City Fed chief Thomas Hoenig on May 6th, in unusually candid remarks. “Rising price pressures are not temporary, as some assert, but are more serious. These increases are beginning to generate an inflation psychology to an extent that I have not seen since the 1970's and early 1980's. Energy, food and other commodities have simply soared. If an inflationary psychology becomes embedded, it will require significant monetary policy tightening to reduce it,” he warned.
Yet soaring commodity inflation is greatly at odds with historically low US Treasury yields, and it's difficult to understand why investors are still holding 10-year US Treasury notes, which could be the next major bubble to burst. Aren't strong price pressures in the commodities markets getting noticed in the bond market, especially with oil shooting north of $125 a barrel, retail gasoline costs at $4 a gallon and basic food staples such as corn, soybeans, wheat and rice doubling in price?
China and Japan boosted their holdings of US Treasury securities by $18 billion in March, and the Arab oil kingdoms added $25 billion, mostly through their brokers in London. However, institutional investors worldwide have plowed $40 billion into commodity index funds so far this year, lifting their bets to $200 billion. Retail investors added $16 billion into commodity exchange-traded funds (ETFs) in the first four months of this year, and ahead of last year's pace of $15 billion.
The Dow Jones Commodity Index is up 24.5%, and the Reuter's CRB Index, with a greater energy weighting, is up 39% from a year ago, far outpacing the returns in US Treasuries, in an environment of escalating inflation.
.gif)
The Fed's last two rate cuts equaling 100 basis points to 2% have back-fired, by lifting the commodities markets, especially crude oil, while undermining the 10-year Treasury note market, which fell to a three-month low this week, lifting its yield to as high as 3.98 percent. On April 15th, NBER chief economist, Martin Feldstein, a top advisor to the Bernanke Fed, said surging commodity price inflation should stop the US central bank from cutting its overnight lending rate below 2 percent.
“It would make sense for the Fed to stop cutting its target rate at between 2% and 2.25%, because to go lower could exacerbate the problem of inflation emanating from high commodity prices,” Feldstein said on CNBC television. There is now widespread speculation that the Fed's rate cutting spree has ended at 2%, but most likely, the central bank will drag its heels on combating inflation, and move in slow-motion baby-steps, when raising interest rates.
Seeking a quick fix to the slide in US T-Notes, the US Treasury is banking on the doctored-up consumer price index to contain the rise in 10-year yields at 4 percent. Yet efforts to keep interest rates below the inflation rate, simply provides fertile ground for commodity traders and operators in the stock market.
Japanese Bond Traders awaken from Grand Illusion,
Japanese bond traders have been brainwashed by government propaganda artists for more than a decade, and programmed into believing that Japan, one of the world's biggest importers of food and energy, is immune to global inflation. But after reporting a decade of deflation, Ministry of Finance apparatchniks are finally forced to paint a rising inflation trend, after crude oil prices doubled and a ton of Asian grown rice soared 120% from a year ago.
Last month, Japanese consumer inflation was reported at a decade-high of 1.2% in March, led by rising fuel, raw materials and food prices. Ironically, the Bank of Japan's super-low interest rate of 0.50% encourages global traders to borrow funds in yen, in order to bid-up commodities and stocks worldwide. Yet it's tough to get the BoJ to shift to a tighter money policy, because the Japanese government is addicted to low interest rates, saddled with a national debt of $6.7 trillion.
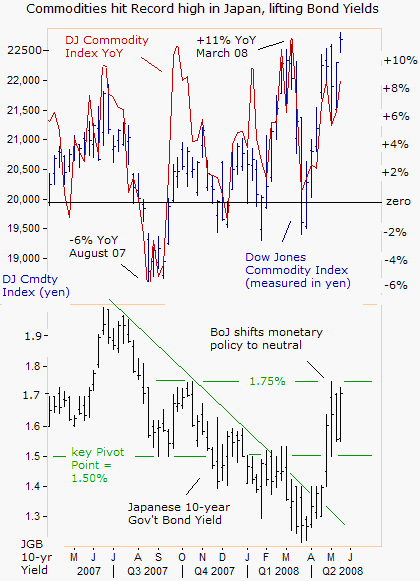
Earlier this week, Japanese 10-year government bond (JGB) yields surged 20 basis points to a seven-month high of 1.75%, while at the same time, the DJ Commodity Index jumped to a record high at 22,600-yen. Two weeks ago, on April 25th the JGB market suffered its biggest one-day JGB fall in five-years, as foreign investors sold a net 588-billion yen ($5.6 billion) of Japanese bonds, spooked by signs of inflation.
Tokyo tried to hold down the cost of imported commodities, especially for base metals, crude oil, and grains, by allowing the Japanese yen to rise against the US dollar. A 13% rise in the yen helped to cap the year-over-year increase in the Dow Jones Commodity Index to 10% in local currency terms. However, the yen has begun to weaken again from its peak on March 17th, which is allowing global inflationary pressures to sneak into the Japanese economy.
Will the Bank of Japan tighten its monetary policy to strengthen the yen and cap the rise in commodity prices? On May 12th, BoJ chief Masaaki Shirakawa said, no. “We need to bear in mind that real short-term interest rates are around zero, a very low level. So if we are certain that the Japanese economy will follow a growth path under stable prices, we will be adjusting interest rates. However, we are now at the stage where we need to pay utmost attention to the downside risks to the economy.”
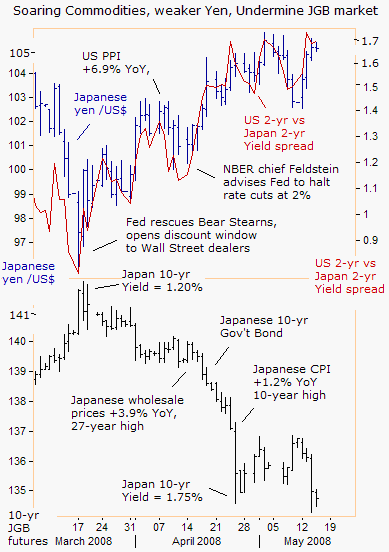
The Bank of Japan has kept its overnight loan rate pegged at an abnormally low 0.50% for the past 15-months. However, since the Fed's climactic rescue of Bear Stearns on March 17th, yields on the US Treasury's 2-year note have risen faster than comparable Japan yields, climbing to +168 basis points today, from a low of +80 bp in mid-March, when the dollar fell to a 13-year low of 96-yen.
But soaring commodity and global shipping costs, combined with a weaker yen, are now conspiring to ratchet up inflation in the world's second largest economy, which in turn, is starting to undermine the Japanese bond market. At some point in the future, when the Nikkei-225 climbs out of danger's way, the BoJ could eventually vote for a baby-step 0.25% rate hike to 0.75% in the months ahead.
Global Commodity Boom Rocks South Africa
As a major exporter of platinum, gold, and coal, there is a chance that South Africa might erase last year's $5.5 billion trade deficit, even as it grapples with soaring oil prices. Still, the South African rand is roughly 15% lower against the US dollar, and the Dow Jones Commodity Index is 40% higher from a year ago. On May 15th, South African central bank (RBSA) chief central bank chief Tito Mboweni pointed to soaring food and fuel prices as the main risks to inflation, and warned that these pressures are spreading to other sectors throughout Africa's largest economy.
The targeted CPIX consumer inflation gauge is far above the RBSA's 3-6% target range, hitting a five-year high of 10.1% in March. “Initially, these shocks were confined to oil and food prices, but more recently electricity price increases have compounded the problems,” the RBSA said. A 14.2% increase in the electricity tariff approved in April, and the possibility of a weaker rand have worsened the inflation outlook. State power utility Eskom, struggling to meet rising demand for electricity, has already asked for another 53% rate hike.
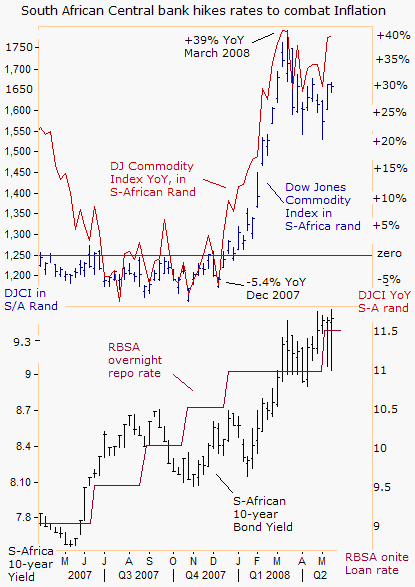
The RBSA has lifted its repo rate by 450 basis points to 11.5% since June 2006, to curb credit-driven consumer demand. “The MPC remains committed to bringing inflation back to within the target range over a reasonable time horizon. From time to time central banks will confront the problem of persistently stubborn high inflation. The job of the central bank in that situation is to tighten monetary conditions to try and bring inflation back to within the target range as soon as possible. Whether a country pursues inflation targeting or not, any central bank worth its salt would pursue low inflation,” Mboweni said on May 15th.
Unlike the “Group of Seven” central bankers, who hide behind distorted government inflation data, to keep their interest rates low, South Africa's central bank is beyond the “jawboning” stage, and is actively tightening its monetary policy, to prevent further weakness in the rand, and contain commodity inflation. The RBSA could certainly use a helping hand from the G-7 central banks, in the form of tighter monetary policies, to help control global inflation.
By Gary Dorsch,
Editor, Global Money Trends newsletter
http://www.sirchartsalot.com
To stay on top of volatile markets, subscribe to the Global Money Trends newsletter today, for insightful analysis and predictions for the (1) top stock markets around the world, (2) Commodities such as crude oil, copper, gold, silver, and related gold mining and oil company indexes (3) Foreign currencies (4) Libor interest rates, global bond markets and central bank monetary policies, and (5) Central banker "Jawboning" and Intervention techniques that move markets.
GMT filters important news and information into (1) bullet-point, easy to understand analysis, (2) featuring "Inter-Market Technical Analysis" that visually displays the dynamic inter-relationships between foreign currencies, commodities, interest rates and the stock markets from a dozen key countries around the world. Also included are (3) charts of key economic statistics of foreign countries that move markets.
Subscribers can also listen to bi-weekly Audio Broadcasts, with the latest news on global markets, and view our updated model portfolio for Q'1, 2008. To order a subscription to Global Money Trends, click on the hyperlink below, http://www.sirchartsalot.com/newsletters.php
Mr Dorsch worked on the trading floor of the Chicago Mercantile Exchange for nine years as the chief Financial Futures Analyst for three clearing firms, Oppenheimer Rouse Futures Inc, GH Miller and Company, and a commodity fund at the LNS Financial Group.
As a transactional broker for Charles Schwab's Global Investment Services department, Mr Dorsch handled thousands of customer trades in 45 stock exchanges around the world, including Australia, Canada, Japan, Hong Kong, the Euro zone, London, Toronto, South Africa, Mexico, and New Zealand, and Canadian oil trusts, ADR's and Exchange Traded Funds.
He wrote a weekly newsletter from 2000 thru September 2005 called, "Foreign Currency Trends" for Charles Schwab's Global Investment department, featuring inter-market technical analysis, to understand the dynamic inter-relationships between the foreign exchange, global bond and stock markets, and key industrial commodities.
Copyright © 2005-2008 SirChartsAlot, Inc. All rights reserved.
Disclaimer: SirChartsAlot.com's analysis and insights are based upon data gathered by it from various sources believed to be reliable, complete and accurate. However, no guarantee is made by SirChartsAlot.com as to the reliability, completeness and accuracy of the data so analyzed. SirChartsAlot.com is in the business of gathering information, analyzing it and disseminating the analysis for informational and educational purposes only. SirChartsAlot.com attempts to analyze trends, not make recommendations. All statements and expressions are the opinion of SirChartsAlot.com and are not meant to be investment advice or solicitation or recommendation to establish market positions. Our opinions are subject to change without notice. SirChartsAlot.com strongly advises readers to conduct thorough research relevant to decisions and verify facts from various independent sources.
Gary Dorsch Archive |
© 2005-2022 http://www.MarketOracle.co.uk - The Market Oracle is a FREE Daily Financial Markets Analysis & Forecasting online publication.