


Top Approaching in Berkshire Hathaway Stock?
Companies / Company Chart Analysis Oct 02, 2014 - 08:39 AM GMTBy: EWI

 Editor's note: The following article originally appeared in a special September-October double issue of Robert Prechter's Elliott Wave Theorist, one of the longest-running financial letters in the business.
It piques our interest when a person or company makes the front page of a magazine or newspaper. On August 15, USA Today ran an article with a chart on the share-price performance of Warren Buffett's company, Berkshire Hathaway. The Guardian and other papers covered the news, too, which was that the stock had cleared $200,000/share.
The stock (symbol BRK-A) has returned a 19.7% compounded annual return to shareholders since 1965, the year Buffett turned a failing textile company into an investment company. It has returned 22.8% annualized since 1977. Let's just say that the stock has produced about 20% per year compounded.
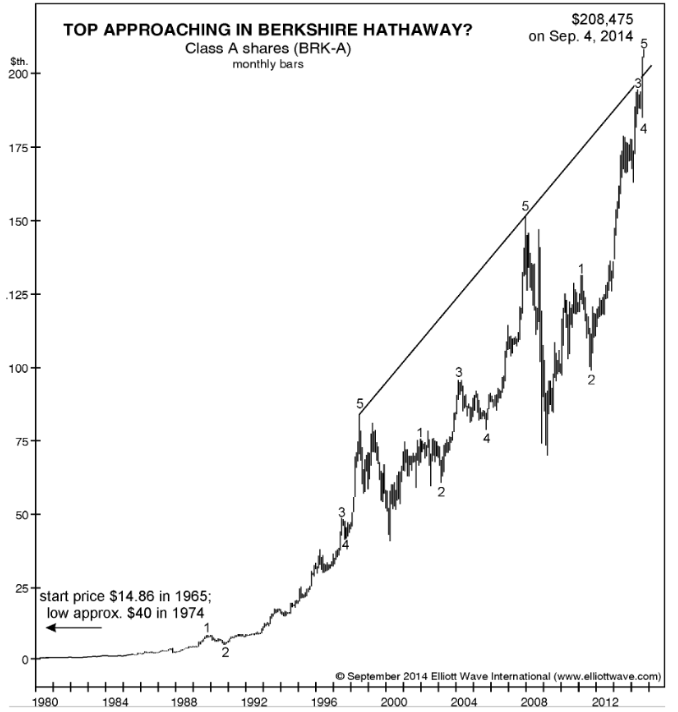
The above figure shows that the stock has just met a 16-year resistance line on arithmetic scale. The next figure shows that it is still a bit shy of that line on log scale.
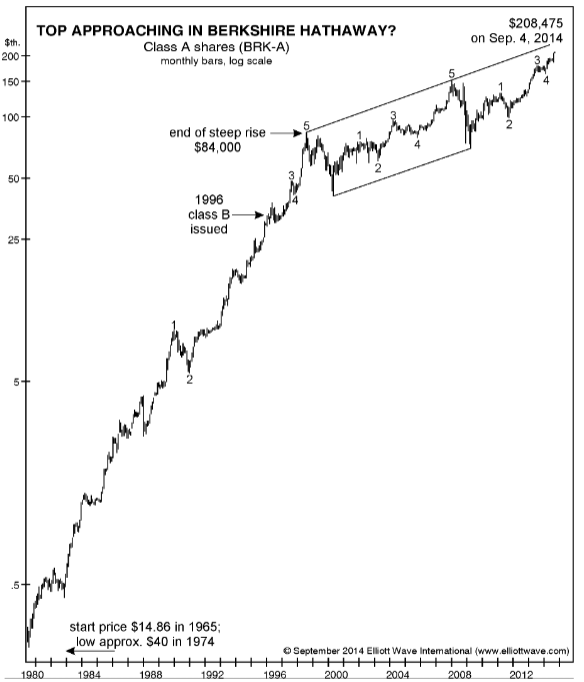
As you can discern from the second figure, the stock enjoyed a persistently steep rise until early 1998. In 1996, the stock was getting a little expensive for the average investor at $30,000/share, so Buffett created a "Class B" stock, a smaller share selling at a fraction of the price of the "Class A" stock. It began trading in May of that year. So, the public was given this opportunity two years before the steep rise ended on June 1, 1998.
Since then the stock has still been beating the market but at a slower pace. To put the difference in perspective, the stock rose 2100 times from the 1974 low of 40 to the 1998 high of 84,000 and only 2.5 times from there to now, which is 1/840th of the multiple in two-thirds the time. Loosely stated, the latter rate of rise is 1/560th of the former.
Buffett's return is amazing, but what makes it more amazing is that he started his investment empire the very year the U.S. domestically went off hard money and one year before the Dow made a major top in terms of real money (gold), which it is well below today. The era of rubber finance has goosed investment compounding, and Buffett's style was made for it.
We could be wrong, but we think the era of inflationary finance is ending. Its time is due, the price is right, and the Fed is so far out on a limb with leverage that QE-infinity seems unlikely. It will be interesting to see how BRK-A does when the monetary environment fundamentally changes from expansionary to contractionary. Even if it continues to outperform most other funds in the bear market, it is still likely to succumb to its biggest setback ever.
Showing (in our opinion) continued acumen, Berkshire Hathaway "currently has $50-billion-plus in free cash, the biggest cash hoard ever."
Naturally, "(Buffett) is still bullish and still looking [for buys]." (USA Today, 8/15/14) Things could hardly seem better. But often that's a good time to sell.
It's difficult to lean against the crowd and doing so doesn't automatically mean that you'll be right. There are never guarantees. But the odds are in your favor.
Please know that EWI does not recommend defying the crowd for its own sake. To be sure, a contrarian can get trampled during the strongest parts of bull markets, or mauled during the worst part of bear markets.
A prudent investor looks at the best available evidence before deciding how, when and if to act.
Be assured, dear reader: Your risk-free review will likely be one of the most important investments you make at this juncture.
To that end, EWI offers you a no-obligation education in Elliott Wave analysis. See below for details.
|
Learn the Why, What and How of Elliott Wave AnalysisThe Elliott Wave Crash Course is a series of three FREE videos that demolishes the widely held notion that news drives the markets. Each video will provide a basis for using Elliott wave analysis in your own trading and investing decisions. Watch the Elliott Wave Video Crash Course now >> |

This article was syndicated by Elliott Wave International and was originally published under the headline Top Approaching in Berkshire Hathaway (BRK-A)?. EWI is the world's largest market forecasting firm. Its staff of full-time analysts led by Chartered Market Technician Robert Prechter provides 24-hour-a-day market analysis to institutional and private investors around the world.
About the Publisher, Elliott Wave International
Founded in 1979 by Robert R. Prechter Jr., Elliott Wave International (EWI) is the world's largest market forecasting firm. Its staff of full-time analysts provides 24-hour-a-day market analysis to institutional and private investors around the world.
© 2005-2022 http://www.MarketOracle.co.uk - The Market Oracle is a FREE Daily Financial Markets Analysis & Forecasting online publication.