


Uranium Stocks Upside Breakout
Commodities / Uranium May 21, 2008 - 05:57 AM GMTBy: Merv_Burak

 AND AWAY WE GO.
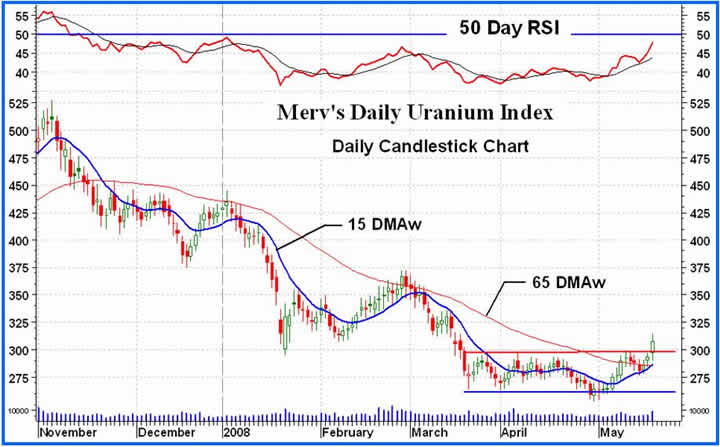
The box that has been such a confining feature of the Index action for so many weeks has been decisively broken, on the up side. The Index made a sharp upside move, and with significant volume action. All looks gung-ho for a good rally, maybe even a reversal of long term trend although that will still require much more work. However, let's calm down for a few minutes and see exactly what the charts and indicators are really telling us.
The Merv's Daily Uranium Index closed higher by 14.10 points or 4.81%. Even taking into account that yesterday was a holiday in Canada, where most of our stocks trade, that was a good day's work. There were 38 daily winners, 10 losers and 2 unchanged. Of the five largest stocks it almost goes without saying that they all closed higher. Cameco gained 3.0%, Denison gained 8.1%, First Uranium Gained 0.2%, Paladin gained 5.2% and Uranium One gained 9.5%. The best gainer was Fronteer Development with a gain of 22.8%. There were two others within a couple of decimal % of that. The worst performer was Altius Energy with a loss of 6.5%.
As mentioned above, the Index still has some ways to go to affect the long term but the intermediate term has continued its positive transformation. The Index is well above its intermediate term moving average line and the line has just turned into the up side. As the chart shows, the momentum indicator is pointing almost straight upwards but is still slightly below its neutral line in the negative zone. It is, however, well above its positive sloping trigger line. As for the volume indicator (not shown) it is moving higher at a rapid rate. It is just about to breach its previous high set during the late February action. All in all, despite the momentum not yet in its positive zone, the charts and indicators sum up to an intermediate term BULLISH rating for the first time since last November.
Both the short and immediate (or very short) term are confirming the latest positive information. On the short term the Index is above its positive moving average line while the momentum indicator is continuing to move sharply higher in its positive zone, above its positive trigger line. It is, however, getting close to entering its overbought zone at which point we could start to expect some reaction to the move. The day's volume action was the best in several weeks. The short term can only be rated as BULLISH .
As for the immediate term direction, that is up, up and away. Although the Stochastic Oscillator is the more aggressive momentum indicator that I use for my analysis it is still some distance from its overbought zone. Further away than the short term momentum from its overbought zone. On the other hand the SO has a habit of moving a lot faster than the RSI and may enter its overbought zone first, although it really doesn't matter which gets there first. The immediate direction of the Index continues to be to the up side.
It's times like this when the tables of technical information and ratings really come in handy to gauge which stocks may be the better upside plays. Tomorrow evening the daily version of the table gets posted. The short term info in the daily table may be used for short term action as it is quite accurate, at least as of the Wednesday data. In the weekly table one should not use the short term information for anything other than confirmation of the intermediate or long term trend. Using weekly data is not very good to get short term trading information. As I had mentioned when the daily table was introduced, the indicators are the same as those I use for my daily commentary.
By Merv Burak, CMT
Hudson Aero/Systems Inc.
Technical Information Group
for Merv's Precious Metals Central
For DAILY Uranium stock commentary and WEEKLY Uranium market update check out my new Technically Uranium with Merv blog at http://techuranium.blogspot.com .
During the day Merv practices his engineering profession as a Consulting Aerospace Engineer. Once the sun goes down and night descends upon the earth Merv dons his other hat as a Chartered Market Technician ( CMT ) and tries to decipher what's going on in the securities markets. As an underground surveyor in the gold mines of Canada 's Northwest Territories in his youth, Merv has a soft spot for the gold industry and has developed several Gold Indices reflecting different aspects of the industry. As a basically lazy individual Merv's driving focus is to KEEP IT SIMPLE .
To find out more about Merv's various Gold Indices and component stocks, please visit http://preciousmetalscentral.com . There you will find samples of the Indices and their component stocks plus other publications of interest to gold investors.
Before you invest, Always check your market timing with a Qualified Professional Market Technician
Merv Burak Archive |
© 2005-2022 http://www.MarketOracle.co.uk - The Market Oracle is a FREE Daily Financial Markets Analysis & Forecasting online publication.