


Stock Market Time for a Bounce
Stock-Markets / Stock Markets 2014 Dec 15, 2014 - 11:36 AM GMTBy: Andre_Gratian

 Current Position of the Market
SPX: Long-term trend - Bull Market
Intermediate trend - A correction of currently indeterminate time frame has started. There is a good chance, however, that it will be more than a short-term correction.
Analysis of the short-term trend is done on a daily basis with the help of hourly charts. It is an important adjunct to the analysis of daily and weekly charts which discusses the course of longer market trends.
TIME FOR A BOUNCE
Market Overview
For the week, SPX lost 77 points and DJIA a little over 700. Technical warnings had been accumulating for several weeks that a correction was due and, in the last couple of letters, I suggested that it could be imminent. Indeed it was! Now we must shift our focus onto how much longer and deeper this correction is likely to be. The bulls will be happy to hear that we are nearing a projection level at the same time that some positive divergence is showing in some indicators. This has always been a good recipe for a re-bound and I would expect it to start early next week. If this takes place, we will then try to estimate how much of a rebound it is likely to be. Let's check on the indicators.
Momentum: The weekly MACD has turned down after showing some long-term negative divergence, but it remains strongly positive and, in spite of the decline, it has not yet made a bearish cross. The daily MACD has made a bearish cross but did so only after making a new high, hence no negative divergence. It also remains positive.
The weekly SRSI has just barely made a bearish cross and has dropped to neutral. The Daily has been negative for some time and oversold as well.
Breadth: The McClellan Oscillator is now in a downtrend and has reached a mildly oversold position. This has turned the Summation index back down. We'll analyze it a little later.
Structure: Probably still in primary wave 3, but this could be the beginning of wave 4. More data is required to clarify.
Accumulation/distribution. Short-term: None! Long-term: Current top pattern nearly exhausted.
XIV: Has paced the SPX on the downside. It started to show some positive divergence late Friday.
Cycles: The short-term cycle low was ideally due on Friday, with the possibility of extending into Monday or Tuesday.
This decline could be a shot across the bow by the 7-year cycle topping.
Chart Analysis
We start with the weekly SPX (chart courtesy of QCharts, including others below) with the McClellan Summation Index posted underneath it.
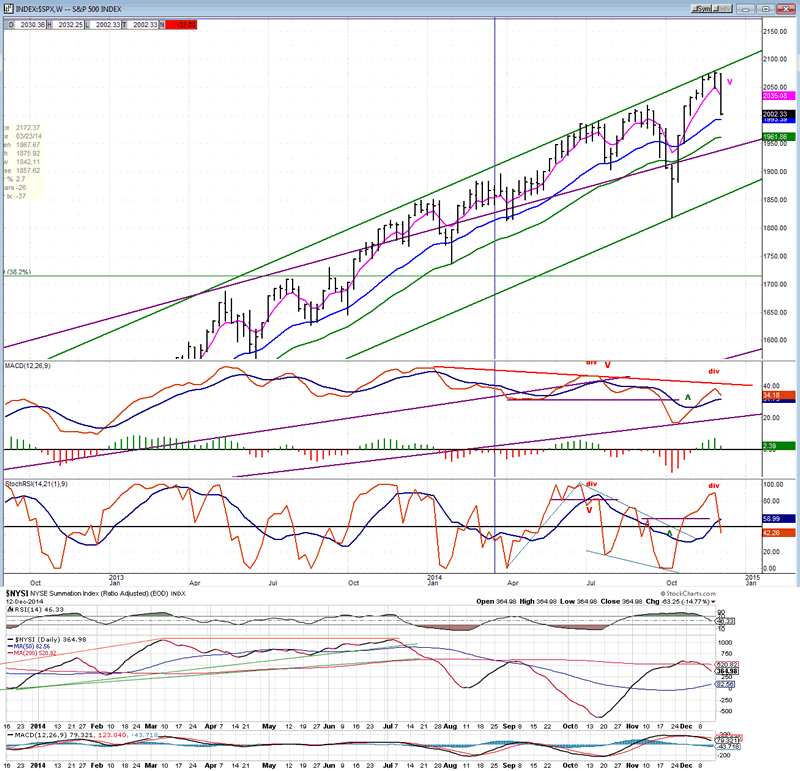
Once again, the top of the intermediate channel has stopped the SPX from moving higher but this time, it did not take as long to cause a reversal. Of course, bears had help from plunging oil prices and the retracement was abrupt, but not too different from what happened in July. In fact, the July decline found support on its 21-wk MA and, since we almost reached it last week, I would not be surprised if we repeated the July pattern this coming week, but not necessarily with a new high just ahead. There are several contributing factors besides the MA support. For one, the cycle which, ostensibly, at least partly contributed to the decline is supposed to be at or near its low. Also, some of the leading indicators were showing deceleration at Friday's close. As mentioned above, we are also approaching a Point & Figure projection which is supported by a Fib measurement. We cannot ignore these warnings and it would make sense if at least a temporary low would form in this area -- perhaps as early as Monday. There is no accumulation in the short-term P&F chart, so we will either have to create a base if we want this bounce to have some upside potential, or have a V-bottom reversal similar to the one that was created at the last low. But the weekly indicators are still declining and the Summation index, especially, does not show that the selling pressure has been totally relieved in either its RSI or its MACD. That could suggest that this correction will continue until such a time as both of the weekly indicators are more ready for a reversal.
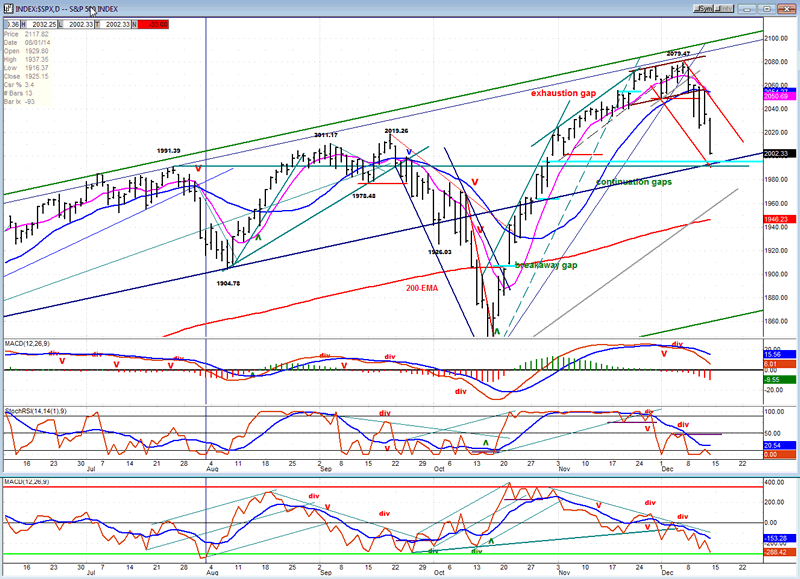
Let's now turn to the daily chart. Right away, we can add a couple more factors to our list of reasons for finding support in this time frame. The blue line represents the bottom of an unfilled gap. Filling that gap may be what the market has in mind. It also corresponds to the 1991 top, and the bottom of the red channel. Certainly, those are enough reason to suggest that SPX could bounce from this fast-approaching level.
As far as what kind of a rally we might get from here, none of the oscillators shows positive divergence and I don't think we should expect any worthwhile rally until some has developed. That does not mean that this decline will necessarily go beyond 1820 before finding a low. But that's for another day to decide.
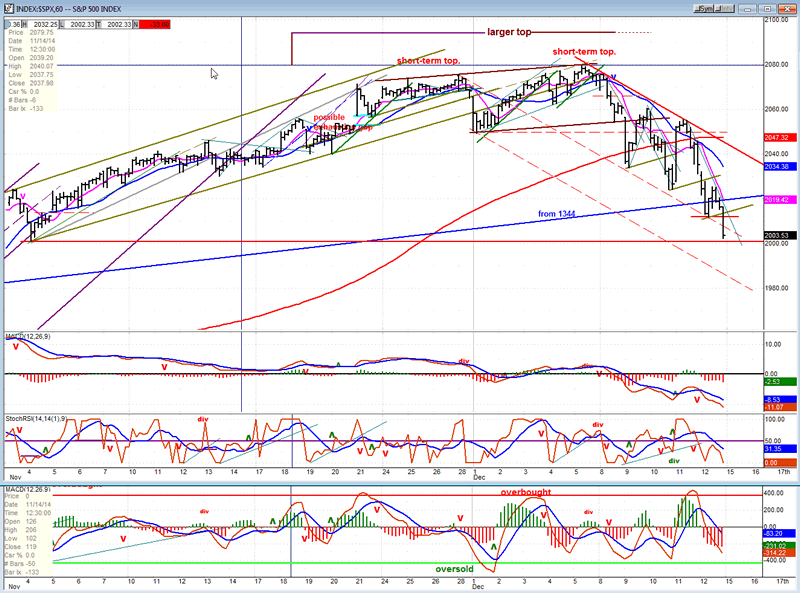
On the hourly chart, we note that we tried to hold at the support provided by the blue trend line from 1344 which was penetrated once by the index on the way down to 1820 -- but was again surpassed on the vicious rally that followed. This time, we are breaking it again and that could be significant; because if the 7-year cycle has topped, after we get through with this decline we may not be able to get back above it a second time. Of course this will largely depend on how far down we go, first.
The oscillators are all still in a declining mode as of Friday's close. This, in itself, is a fair indication that we have not completed the downtrend and that we could expect more on Monday. Even the histograms have not even started to decelerate. I think we can expect the decline to continue into early next week although, as I mentioned above, there is some deceleration showing in the hourly charts of some of the leaders.
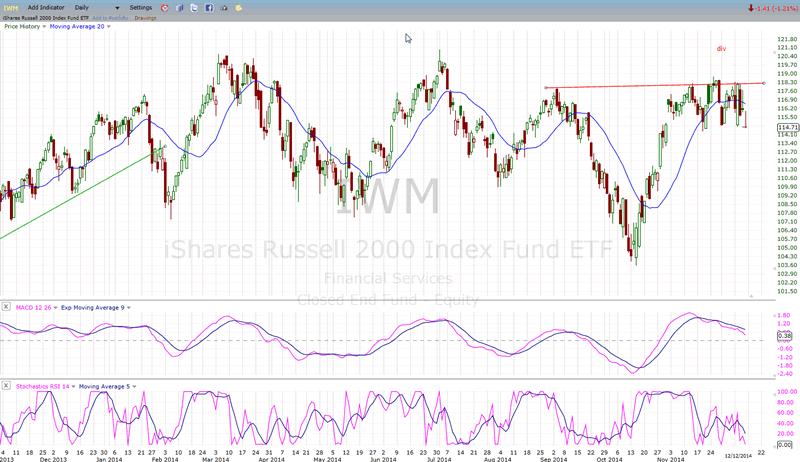
There is one index which should be very helpful in deciding what kind of decline has started, and that is the IWM. On the P&F chart, that index has traded in a tight range over the past few weeks -- between 115 and 118. We can currently count 12 points of accumulation or distribution, depending on which way price breaks from here. Should it break on the downside, we could expect the move to re-test its 1820 low, and that could suggest that the current market decline will roughly match the previous one. (Emphasis on roughly!)
Sentiment Indicators
The SentimenTrader appears to have stopped publishing its weekly chart of the sentiment gauge. If this is permanent, it's going to be tough to find something that matches it (for free!). Jason may have felt that he was giving away too much valuable information. It's not a huge loss, but it will be missed!
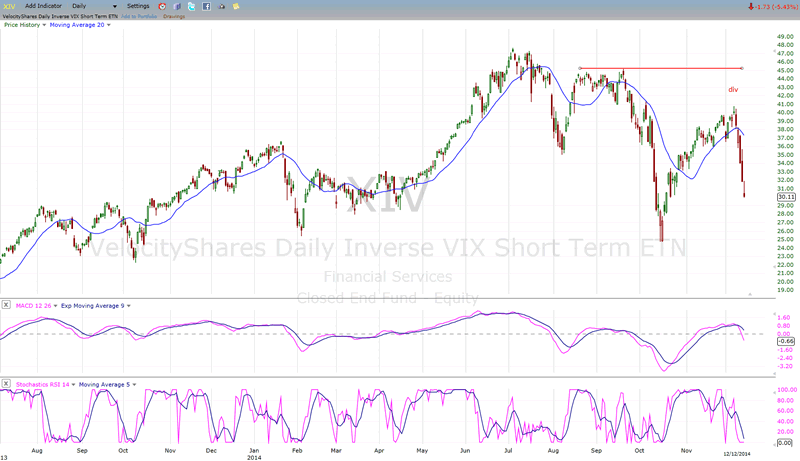
XIV (Inverse NYSE Volatility Index) - Leads and confirms market reversals.
The divergence shown by XIV proved to be a valuable warning that a top was occurring in the market. As you can see at the last low, XIV did not exhibit any divergence because of the V-bottom nature of the reversal. We'll have to see if this holds true for the next low as well. At the moment, there is nothing showing that would lead us to assume that a low is in place.
IWM (iShares Russell 2000) - Historically a market leader.
As you can see, IWM has made a flat congestion pattern which carries a 12 point potential in either direction. I would surmise that the downside carries a definite edge over the top, but let's let the market confirm this.
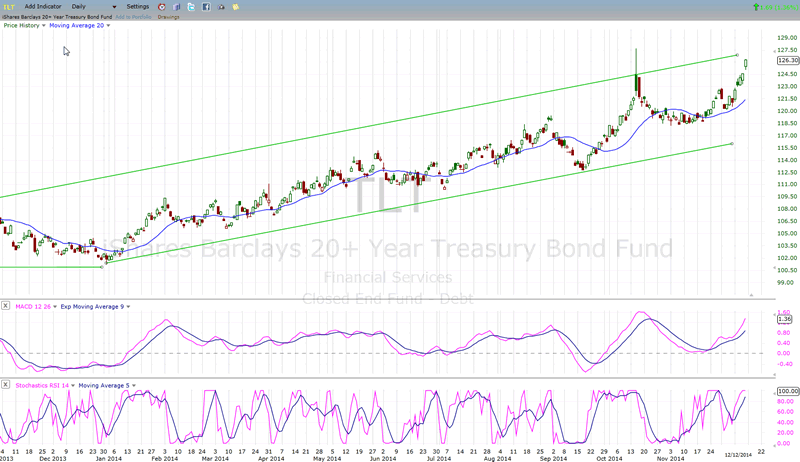
TLT (20+yr Treasury Bond Fund) - Normally runs contrary to the equities market.
Not surprisingly, TLT continued its up-move while the market was correcting. However, it has reached the top of its channel and has remained below the previous top, as well. That is divergence to the market. The question is, does it tell us something about TLT or the market? Or both!
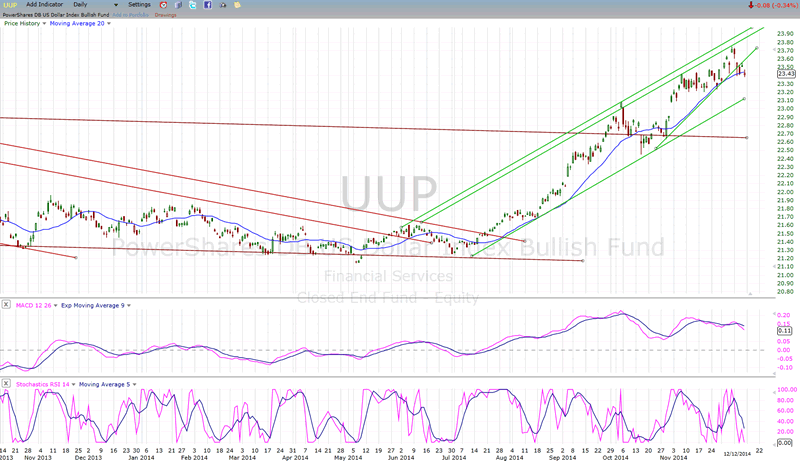
UUP (dollar ETF)
UUP is correcting after touching the top of its channel. If this is a correction of the entire move from the base, it could take a little while to conclude. Let's give it some time.
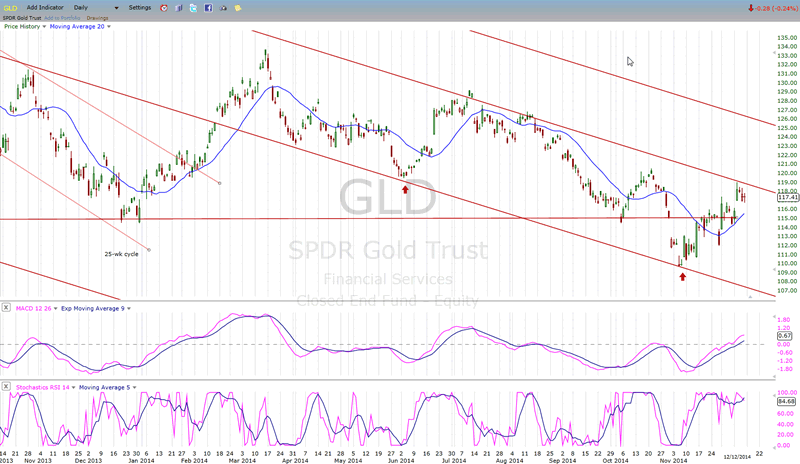
GLD (ETF for gold) - Runs contrary to the dollar index.
GLD made a low which coincided with the bottom of its 25-wk cycle. It has found temporary resistance at the top of a downtrend/channel line but, since there is still plenty of time left in the cycle's up-phase it should be able to break through and extend its move. A potential correction developing in the dollar index should facilitate this move.
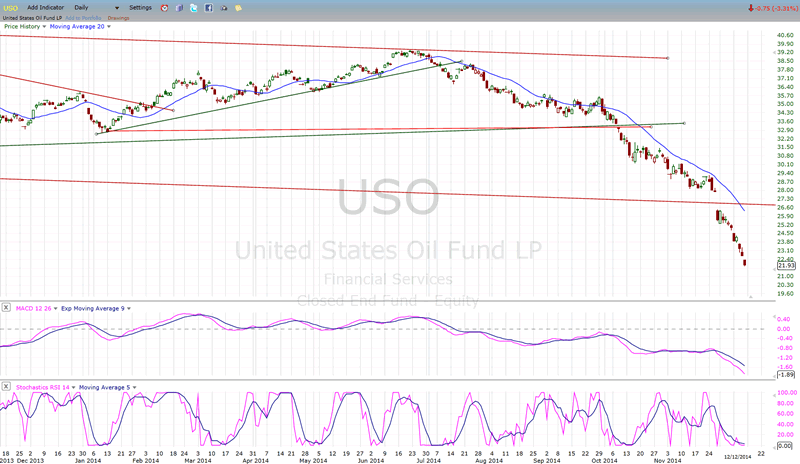
USO (US Oil Fund)
USO's decline, like oil's, has been nothing short of a disaster for the bulls. Crude has dropped to about 58 dollars and may get some relief around 56, which is a partial P&F projection for WTIC. However, this will not be the end of the decline. There is a lower projection down to (at least) about 45. If this is where crude is heading, you can expect USO (and the market?) to follow.
Summary
"SPX has reached an area of strong resistance which is reinforced by a cluster of Fibonacci targets."
This was the first line of last week's summary. It has been vindicated by last week's action. The sharp correction which was experienced by most indices has now brought the SPX close to a potential support level which should create a bounce when reached. There are many short-term factors supporting this view. There are also many longer term factors warning us that this may not be the end of the decline.
Let's keep a close eye on IWM. It could hold the key to what comes next over the following several weeks.
FREE TRIAL SUBSCRIPTON
If precision in market timing for all time framesis something that you find important, you should
Consider taking a trial subscription to my service. It is free, and you will have four weeks to evaluate its worth. It embodies many years of research with the eventual goal of understanding as perfectly as possible how the market functions. I believe that I have achieved this goal.
For a FREE 4-week trial, Send an email to: ajg@cybertrails.com
For further subscription options, payment plans, and for important general information, I encourage
you to visit my website at www.marketurningpoints.com. It contains summaries of my background, my
investment and trading strategies, and my unique method of intra-day communication with
subscribers. I have also started an archive of former newsletters so that you can not only evaluate past performance, but also be aware of the increasing accuracy of forecasts.
Disclaimer - The above comments about the financial markets are based purely on what I consider to be sound technical analysis principles uncompromised by fundamental considerations. They represent my own opinion and are not meant to be construed as trading or investment advice, but are offered as an analytical point of view which might be of interest to those who follow stock market cycles and technical analysis.
Andre Gratian Archive |
© 2005-2022 http://www.MarketOracle.co.uk - The Market Oracle is a FREE Daily Financial Markets Analysis & Forecasting online publication.