


Gold Price Outlook For 2015
Commodities / Gold and Silver 2015 Dec 23, 2014 - 12:11 PM GMTBy: GoldSilverWorlds

 What will gold do in 2015 is a question that is top of mind of many gold investors, particularly during this period of the year. We reached out to gold analyst Ronald-Peter Stoeferle, Managing Partner and fund manager at Incrementum AG in Liechtenstein, author of the In Gold We Trust reports, to get his taken on the outlook for gold for 2015. His expectations for 2015 are summarized by the 10 charts in this article.
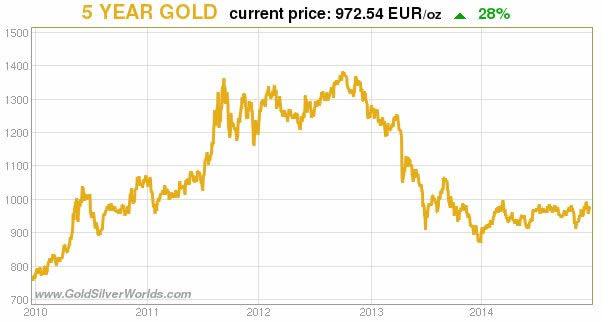
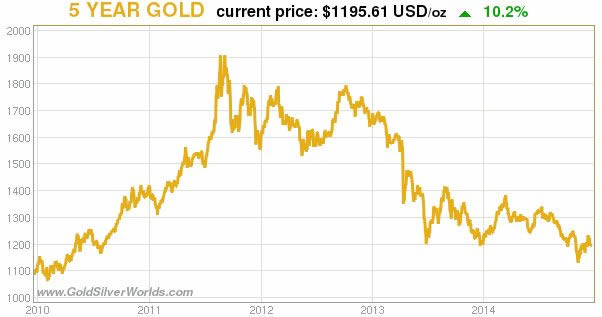
This year was cleary a mixed bag for the precious metals. On the one hand, gold stabilized and confirmed its trading range which was formed after last year’s price crash. Another positive fact is the relative strength of the price of gold in most major currencies non-U.S. Dollar, as evidenced by comparing the first two charts below (the first chart, Euro gold, looks relatively more solid than Dollar gold). On the other hand, silver and the miners went lower and broke below their trading range. That is clearly disinflationary, and disfinlation has been the main message that the precious metals complex has signaled in the past year. That is also the baseline for gold’s outlook for 2015.
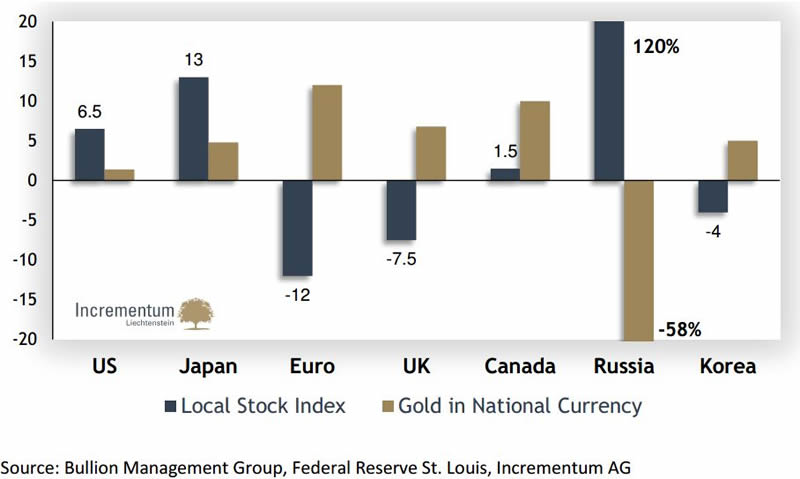
The constant outperformance of the U.S. stock market was the main theme in financial media. Similarly, gold’s weakness has been emphasized over and over again in 2014. That has undoubtedly created the perception that stocks have been a much better investment class than gold. Although that conclusion sounds intuitive to some, it is not supported by the facts as evidenced by the following chart.
The next chart compares gold with the stock market performance in 7 major regions or countries in 2014. It shows that only the U.S. and Japanese stock market outperformed gold in 2014. As an investment asset, holding gold in 2014 was not a bad idea at all.
Gold Outlook In The First Half Of 2015
The Dollar and Euro gold price charts above show that gold was a rather stable asset class which is the baseline going into 2015. Ronald Stoeferle’s outlook for gold in 2015 is based on a continuation of that trend. It would not be realistic to expect a major move higher in the first half of 2015. Why? Because the current monetary and economic environment, characterized by a rise in negative real rates and a weakening of inflation momentum, are not very gold friendly.
The next chart shows negative real rates in blue and the gold price in gold. Since 2001, 56% of months had negative real rates. The level of the interest rates have mostly determined the steepness of the rise of gold. Real rates have been rising since 2011, not coincidentally the top of the gold price. Notice also on the chart how real rates are still in negative territory which suggests that the secular bull market is not over yet. It seems that the correction in the price of gold has reflected a lower level of real interest rates.
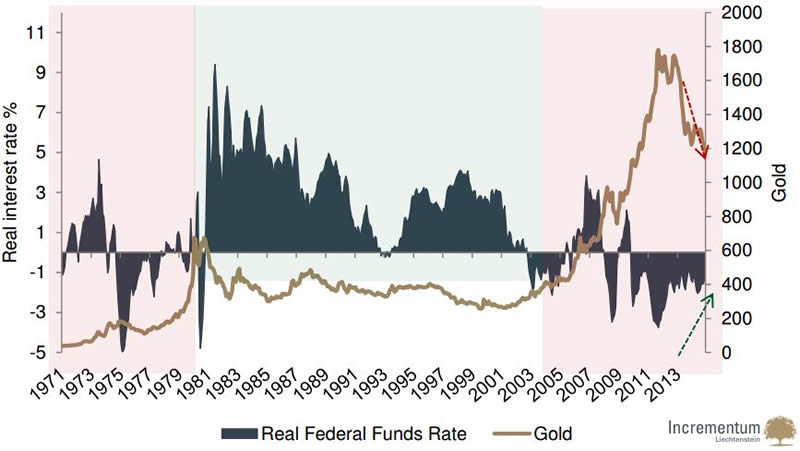
This brings up the question whether we could potentially see positive real rates in 2015 driving gold into a secular bear market? Although nobody knows for sure, it seems an extremely unlikely scenario. First, try to imagine what would happen with the debt servicing cost if rates would rise. Second, with worsening results in the last earnings season(s), the effect of rising rates on corporate bonds would be very destructive. Third, the effect on the real estate market would be slightly devastating. Those are fundamental reasons to believe that the ongoing correction is not secular in nature.
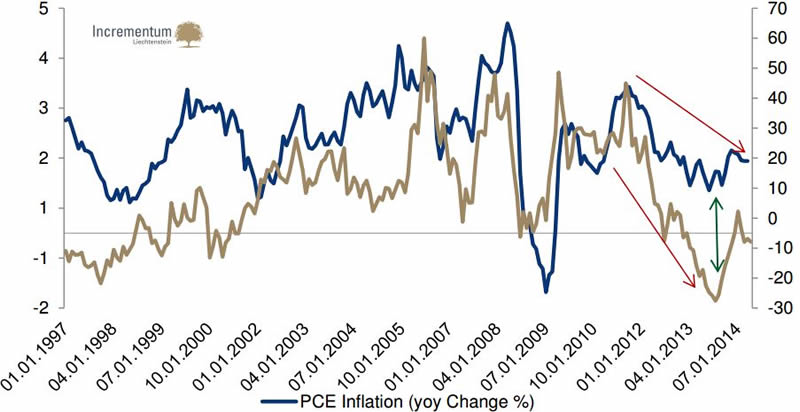
The rate of inflation is slowing down which is, in simple terms, disinflationary. It is not so much the absolute rate of inflation that is relevant for the gold price, but rather the rate of change of inflation. Rising inflation rates generally mean that the environment for the gold price is positive, while falling rates of inflation (= disinflation) indicate the environment is negative. The next three charts set the expectation for the first months of 2015.
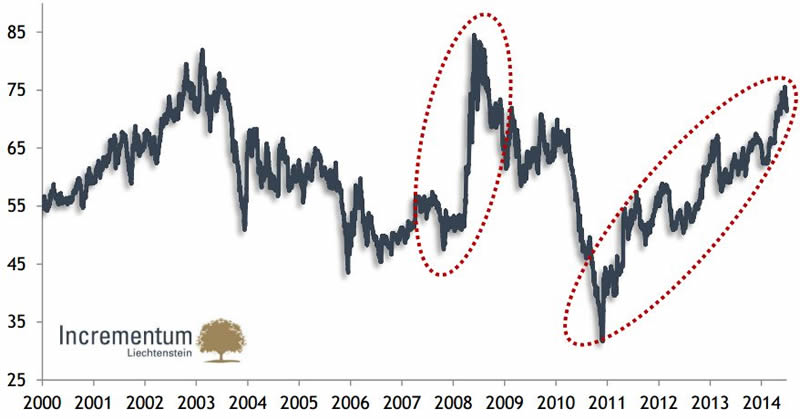
The gold to silver ratio keeps on rising, which points as well to disinflation. Expect this trend to continue in the coming months.
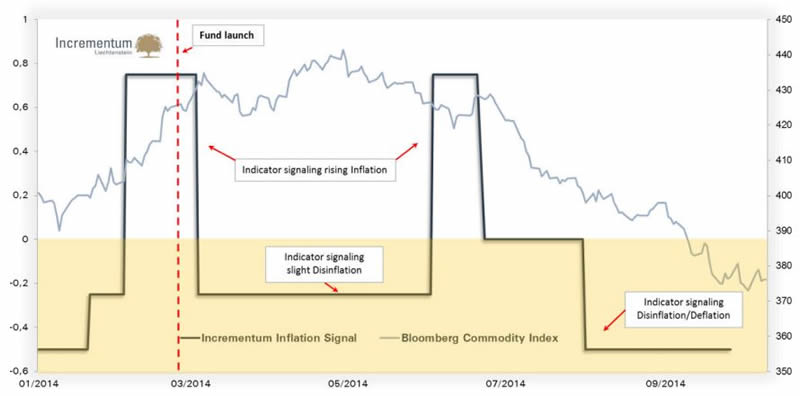
The third confirmation comes from the Incrementum Inflation Signal, a proprietary and an in-house developed indicator which signals the level of inflation / deflation. As the next chart shows, the predictive value of the indicator is very high; it has nailed every inflation rate change of substantial proportion since its inception. It currently has a low reading, comparable to early 2014, so the first period of 2015 should not be very gold friendly.
Meantime, we know for sure that monetary policy makers will continue to be the key trendsetters for the markets, including precious metals. Who believes that central planners have fixed all issues and that 2015 will go smooth economically? Probably central planners themselves hold that belief, as some of them are already starting a deleveraging process. Take the example of the U.S. Fed and Europe (see next chart).
Gold Outlook For 2015 And Later
Monetary policy will undoubtedly be the key driver for markets, money and metals in the years ahead. Stoeferle’s fundamental belief is that we will experience unintended consequences of these monetary interventions resulting in increasing volatility. Although nobody can predict the exact timing, it is realistic to expect this taking place somewhere in 2015.
As suggested by the above charts, the disinflationary trend is likely to continue in the short run. However, based on the steepness of the disinflationary / deflationary phases, one could expect extreme measures by central banks which could result in (highly) inflationary phases. In other words, because of monetary policy, one should realistically expect alternately periods of inflation and deflation.
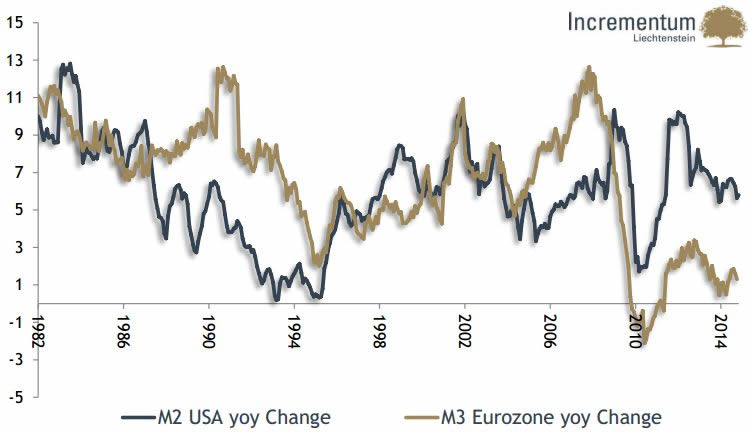
The following chart makes the point on monetary inflation vs disflation. The U.S. and European central banks have embarked upon monetary disinflation in 2014. The real economy has not shown meaningful acceleration, however. It is fair to expect that monetary inflation will return. That is another fundamental driver for gold’s long term prospect.
Astute readers remember which draconian measures the U.S. Fed has underataken since 2007. We sum them up in chronological order: interest rate cuts in 2007/8, zero interest rates and communications policy since 2008, QE I between 2008 and 2010, QE II between 2010 and 2011, Operation Twist between 2011 and 2012, QE III since 2012.
All those measures have had only moderate results in the real economy, i.e. the results have not reflected the extreme character of the measures. That is why a disinflationary bust could be the trigger for central banks to launch one or more of the following measures in 2015:
- more QE
- strengthen the guidance of unemployment and inflation thresholds
- direct measures like the funding for lending program
- very drastic direct measures like helicopter money
- charging interest rates on reserves
Think for a moment about the last point in the list. Charging on reserves is really not that far away. The timing of the article could not have been better in that respect, as only a week ago the Swiss National Bank has announced a negative interest rates on some reserves of Swiss banks.
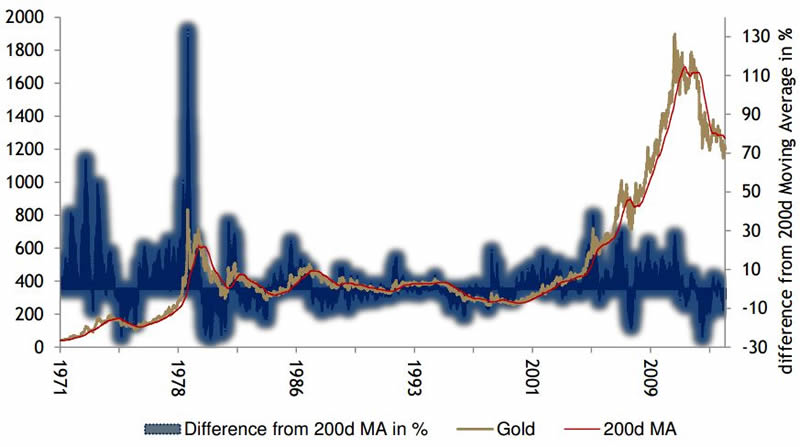
Another indication why gold is not set to rise sharply in 2015 is the historic behaviour of gold’s 200 day moving average. The next chart suggests that periods in which gold had moved longer than average above or below its 200 day moving average have taken some time till normalization or reversal took place.
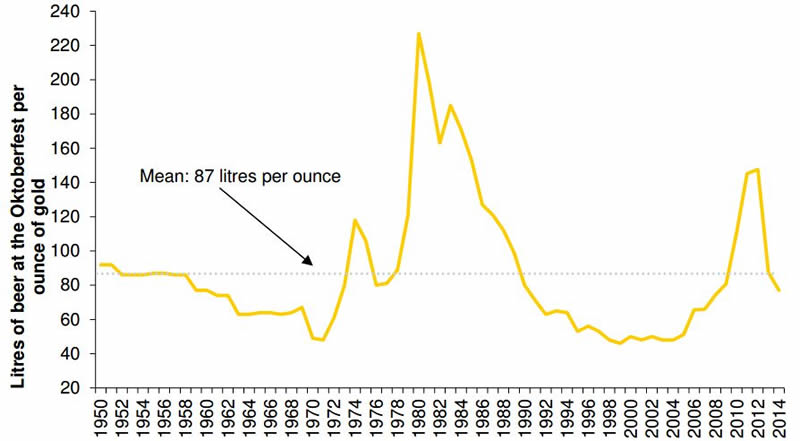
Given all the above trends and data points, Stoeferle feels that gold is in a long term bottom range. Although the price of the yellow metal could go lower in the short run, it seems unlikely that another price crash similar to the one in the first half of 2013 is about to repeat. That is clearly a contrarian call compared to the expectations of “pundits” in the mainstream media (think of the calls of $800 gold).
As anecdotal evidence, the bonus chart below shows the liters of beer that can be bought during the Oktoberfest, with one ounce of gold. It is still above its long term average, suggesting the bull market is still intact.
Source - http://goldsilverworlds.com/investing/ronald-stoeferle-gold-outlook-2015/
© 2014 Copyright goldsilverworlds - All Rights Reserved Disclaimer: The above is a matter of opinion provided for general information purposes only and is not intended as investment advice. Information and analysis above are derived from sources and utilising methods believed to be reliable, but we cannot accept responsibility for any losses you may incur as a result of this analysis. Individuals should consult with their personal financial advisors.
© 2005-2022 http://www.MarketOracle.co.uk - The Market Oracle is a FREE Daily Financial Markets Analysis & Forecasting online publication.