


Berkshire Hathaway Stock Chart Technical Analysis
Companies / Company Chart Analysis Feb 08, 2015 - 03:11 PM GMTBy: Austin_Galt

 BERKSHIRE HATHAWAY INC (BRK.A)
Berkshire Hathaway Inc (BRK.A) is involved in many diverse businesses including insurance, freight rail transportation, utilities and energy. It is listed on the New York Stock Exchange (NYSE) with a market capitalisation of around $350billion. Price last traded at $224,880. To learn more about the company, please visit its website at www.berkshirehathaway.com
Let’s take a bottom up approach beginning with the daily chart.
BRK.A DAILY CHART
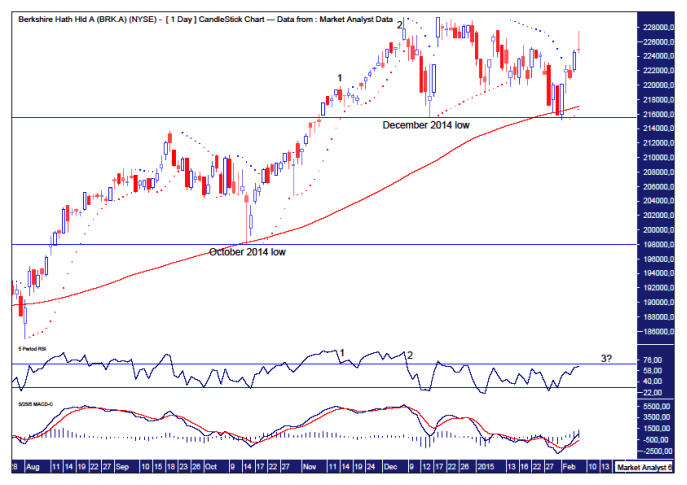
There was some interesting price action to start the month of February. That involved price coming down and clipping the December 2014 low of $215,500. It was only a marginal new low at $215,151. This was a false break low and price has exploded higher which is common behaviour after false break lows.
This also sets up a bullish double bottom as it is with the trend. It is with the trend because it occurred above the previous swing low which was set in October 2014. These double bottoms generally provide the springboard for price to launch to new highs and while it hasn’t happened yet it does indeed look likely.
This recent February low found support at the 100 period moving average which is denoted by the red line. This moving average also held the previous swing low on October 2014.
The Parabolic Stop and Reverse (PSAR) indicator shows price busted resistance given by the dots on the charts. So a bullish bias is now in play.
The Relative Strength Indicator (RSI) is trending up and a new high looks like it may set up a triple bearish divergence. That normally leads to a significant decline and that is my expectation here.
The Moving Average Convergence Divergence (MACD) indicator is trending up but it is generally in a weak position dominated by a pattern of lower highs and lower lows. This coming high also looks set to be accompanied by a bearish divergence here.
Finally, a common topping pattern consists of three consecutive higher highs. I like to call this a “three strikes and you’re out” top and that looks set to play out here. We already have the first two highs and now just await the third and final high to be put in place.
BRK.A WEEKLY CHART
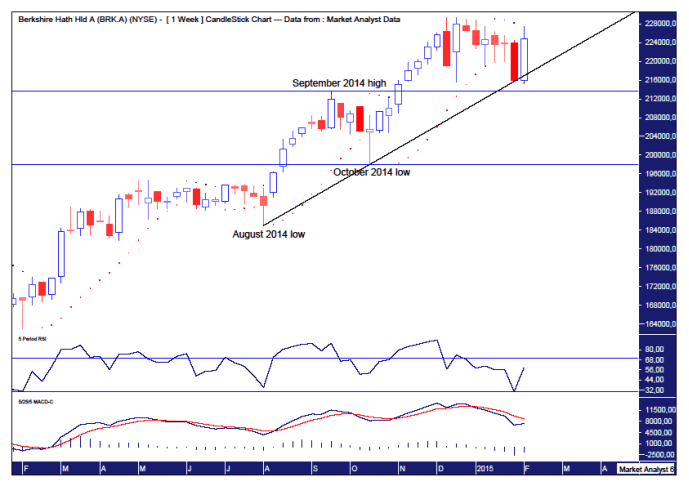
I have drawn an uptrend line connecting the August 2014 and October 2014 lows. This trend line provided support on the recent move down with price clipping this trend line before reversing back up. Nice.
The recent low also came in above the previous swing high set in September 2014 which is denoted by the horizontal line. This keeps the uptrend in a strong position.
A new high is likely to be accompanied by a bearish divergence in both the RSI and MACD indicator.
BRK.A MONTHLY CHART
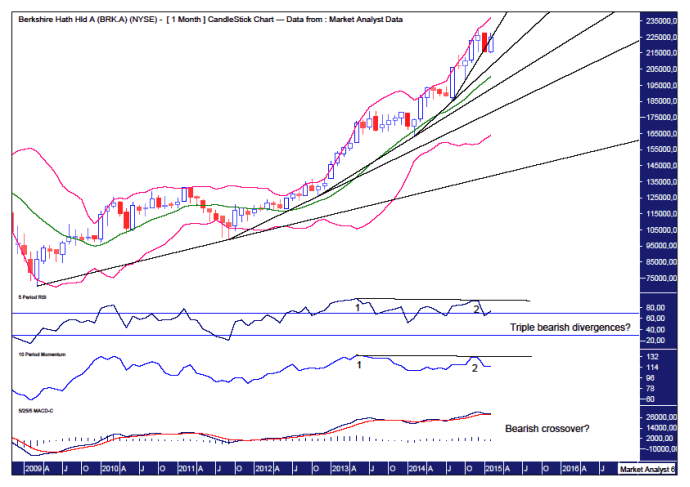
I have drawn several trend lines along bottoms. Each consecutive trend line is becoming steeper which is a sign of the maturation of the bull trend. We now have five steeper trend lines which is generally the limit. This bull trend is not only mature, it is downright old.
Price already has broken below the last trend line and price going to new highs now is the last hurrah. The gravedigger move! I expect come the end of February price will be back below this fifth consecutive trend line.
The Bollinger Bands show price has moved away from the upper band and a move to new price highs now looks to be one last attempt to get back to this upper band.
A new monthly high now looks set to show a triple bearish divergence in both the RSI and Momentum indicator. And this is the monthly chart no less.
Finally, the MACD indicator looks to be threatening a bearish crossover.
Let’s wrap up the analysis by looking at the big picture with the yearly chart.
BRK.A YEARLY CHART
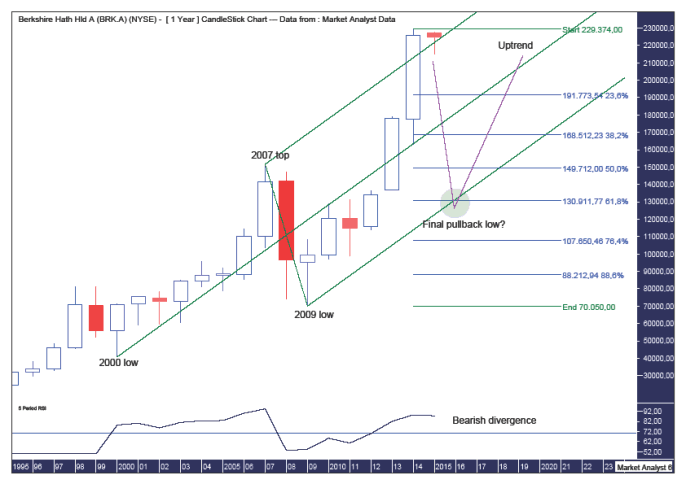
It is clear that a massive bull market is in play as per the pattern of higher highs and higher lows. I now expect a high over the coming days that will put in the next yearly higher high. Then a big move down should be in store that eventually sees a higher low put in place.
I have drawn an Andrew’s Pitchfork with the middle channel beginning at the 2000 low, the upper channel at the 2007 top and the lower channel at the 2009 low. It is quite common to see top do an “up and over” of the upper trend line and that seems to be playing out here too.
The coming top looks set to show a bearish divergence on the RSI so considering this is the yearly chart then a substantial move down is likely.
Once the final top is in place I expect price to come all the way back to the lower trend line and just as the top is a false break of the upper trend line so too is the low likely to be a false break of the lower trend line.
I have also added Fibonacci retracement levels of the move up from 2009 low to recent high. Now keep in mind I think the final high is yet to be seen but it shouldn’t overly affect this analysis. I favour the final pullback low being around the 61.8% level at $130,911.
I have drawn a green highlighted circle which denotes the area I favour for the final pullback low. The timing is in 2016 and a touch under the 61.8% Fibonacci level and a touch under the lower Andrew’s Pitchfork trend line. Let’s see!
Betting against Warren is generally a mug’s game but I’m not playing the man. I’m playing the chart.
Disclosure – I have no financial interest in BRK.A.
By Austin Galt
Austin Galt is The Voodoo Analyst. I have studied charts for over 20 years and am currently a private trader. Several years ago I worked as a licensed advisor with a well known Australian stock broker. While there was an abundance of fundamental analysts, there seemed to be a dearth of technical analysts. My aim here is to provide my view of technical analysis that is both intriguing and misunderstood by many. I like to refer to it as the black magic of stock market analysis.
© 2015 Copyright The Voodoo Analyst - All Rights Reserved
Disclaimer: The above is a matter of opinion provided for general information purposes only and is not intended as investment advice. Information and analysis above are derived from sources and utilising methods believed to be reliable, but we cannot accept responsibility for any losses you may incur as a result of this analysis. Individuals should consult with their personal financial advisors.
© 2005-2022 http://www.MarketOracle.co.uk - The Market Oracle is a FREE Daily Financial Markets Analysis & Forecasting online publication.