


China Copper Con
Commodities / Copper Mar 06, 2015 - 05:58 PM GMTBy: Richard_Mills

 If you needed upwards of 50ml tonnes of copper over the next 5 years, and had very little production of your own, what would you do?
I'm thinking you'd manipulate the market like crazy trying to get everyone to believe there's a huge surplus instead of a major deficit.
How would you do it? Well, we can look at the last time the Chinese manipulated the copper market - they invited every analyst they could find and invited them to China. Showed them all a few warehouses stacked with copper to the roof. Why there was so much copper the ground was compacting said one guy, another said the stacks were falling over like dominos. The world bought the surplus story, swallowed it hook line and sinker. Headlines screamed 'China Has Enough Copper!'
Of course it wasn't true, China needed copper, what they had (2ml tonnes), was tied up in financing deals and at any one time there's at least one million tonnes in transport or somewhere in the process that's tied up, already spoken for, and not available.
And the world gets conned, every year 'experts' predict a surplus, instead what happens? Deficit after supply deficit.
Let's expose the con job.
Copper Consumption
China is going to grow at over 7% this year, that's compounded on top of the 7.3% it grew in 2014 and the year before etc. China is also spending huge amounts of money on infrastructure, especially their power grid.
India, to become competitive, needs to modernize its power grid, so too does Indonesia, they have to build all those smelters for in-country benefaction of ore.
Africa has - by 2050 every 4th person in the world is going to be an African - eight countries on that continent that have better growth rates than China and India.
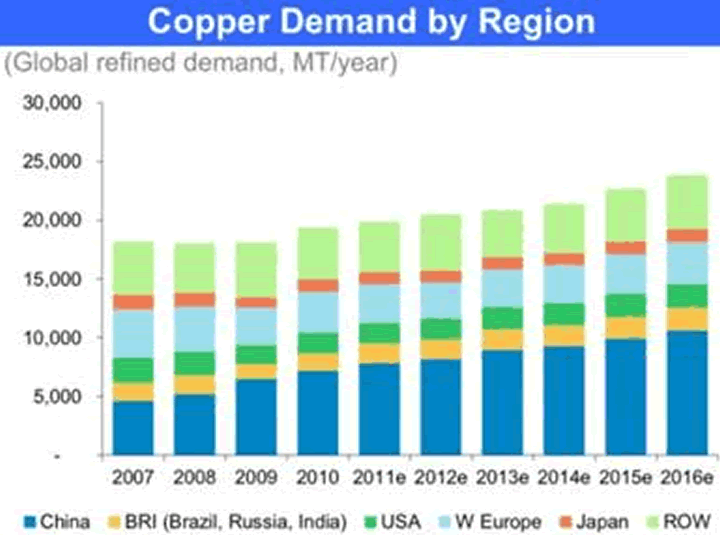
Per capita consumption of copper in the United States was 10 kilograms per person in 1965, the same as in 1995. In Japan, per capita consumption increased from 6 kilograms per person to 11 kilograms per person over the same time period. Copper consumption in Korea in 1965 was less than 1000 tons. By 1995, Korea's consumption of copper had reached 637,000 tons, or more than 14 kilograms per person.
In China, even after years of economic growth, per capita copper usage is about 5.4 kg. As China's populace urbanizes, builds up its infrastructure and becomes more of a consuming society, there's no reason to suspect Chinese copper consumption won't approach or even surpass U.S., Japanese and South Korean levels. There's 1.3 billion people in China, even a slight increase in Chinese consumption will translate into enormous demand growth.
India, with its 1.2 billion people, is presently using 0.4 kg of copper per person. The country is modernizing and needs to invest heavily in electrical power infrastructure. According to the International Energy Agency (IEA), India's power production will need to rise by up to 20 percent annually to keep pace with its economic and population growth. Just meeting the required power target would double India's annual copper consumption.
India's new government, led by Narendra Modi, is focusing on Asian partners China and Japan for enhancing investments in infrastructure and manufacturing. The growth model pursued by China and Japan - export oriented manufacturing, heavy infrastructure building and urbanization - has become India's blueprint for pushing growth up to and beyond the 7 percent mark.
Population Growth
At this moment there are slightly over 7 billion people living on this planet, an urbanization rate of 53 percent means there are roughly 3.71 billion urbanites in the world today. It has been estimated that by the year 2050 our global population will reach 10 billion people. If our global population does indeed reach 10 billion people, and if Birch and Wachter's expected urbanization rate of 70 percent is achieved, seven billion people, or almost the equal of today's current world population will be considered urban.
Could we hit the ten billion people mark? Could 70 percent of us be living in cities by 2050? The answer is likely yes. Developing countries are responsible for 90 per cent of current population growth - these are on average very young people with many years of fertility/reproduction left to them. By the year 2025, in just 10 short years, 84 per cent of the world's people will live in developing regions.
According to the World Health Organization (WHO) "Almost all urban population growth in the next 30 years will occur in cities of developing countries. Between 1995 and 2005, the urban population of developing countries grew by an average of 1.2 million people per week, or around 165 000 people every day. By the middle of the 21st century, it is estimated that the urban population of these counties will more than double, increasing from 2.5 billion in 2009 to almost 5.2 billion in 2050."
The developing world's urban centers are expected to burgeon, drawing 96 percent of the additional 1.4 billion people by 2030. Due to the overall growing global population - but especially an exploding urban population (urban populations consume much more food, energy, and durable goods than rural populations) - demand for water, food, housing, heat, energy, clothing, and consumer goods is going to increase at an astounding rate.
According to the International Monetary Fund (IMF) the consumption of metals typically grows together with income until real GDP per capita reaches about $15,000-$20,000 per capita (2005 int$) as countries go through a period of industrialization and infrastructure construction.
A few country's stand out as well below the IMF's $15,000.00:
- China - 9,233
- Indonesia - 4,956
- Philippines - 4,410
- India - 3,876 Pakistan - 2,891
- Pakistan - 2,891
Since they are still a considerable distance from the point where further increases in GDP per capita no longer increase copper consumption per person, China, Indonesia, the Philippines, India and Pakistan (and the other 113 out of 180 countries listed below the IMF's 15,000 Int$ cutoff) are likely to continue to add significantly to global demand for copper for some time to come.
Tomorrow's Copper Demand
According to the Minerals Education Coalition every American born will need 978 pounds of copper over their lifetime.
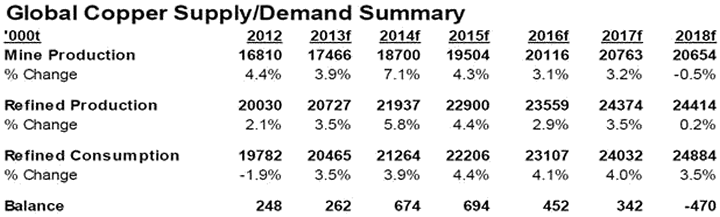
We can see in the above Wood MacKenzie, Macquarie Research graph, from an August 2013 report, a projected refined shortage in 2018. The surplus forecast between now and then is diminutive in relation to the sheer size of the copper market and copper production often falls short of forecasts due to accidents, strikes, ore degradation or power shortages. Disruptions in the copper market averaged 900,000 tonnes of copper supply per year between 2004 and 2012.
We already have one billion people out of today's current population slated to become significant consumers by 2025.
Another 2.8 billion people will be added to the world between now and 2050. Most will not be Americans but they are going to want a lot of things that we in the western developed world take for granted - electricity, plumbing, appliances, AC etc.
"Infinite growth of material consumption in a finite world is an impossibility." E. F. Schumacher
"We're living in a finite world, one in which resource constraints are becoming increasingly binding." Paul Krugman, 'The Finite World'
Copper Parity
But what if all these new one billion consumers were to start consuming, over the next 10 years, just like an American? What's going to happen to the world's mineral resources if one billion more 'Americans' are added to the consuming class? Here's what each of them would need to consume, per year, to live the American lifestyle...
In 2010, more than 38,000 pounds (19 tons) of minerals and fuels were needed per person to maintain the American lifestyle.
Out of the 38,000 total pounds needed, 21,675 pounds were energy fuels - the coal, petroleum, natural gas, uranium - required for transportation and to heat, cool and light homes and businesses.
One billion new consumers by 2025. Can everyone who wants to, live an American lifestyle? Can everyone everywhere else have everything we in North America have? The answer is a resounding no!
If we mined every last discovered, and undiscovered, pound of land based copper the expected 8.2 billion people in the developing world would only get three quarters of the way towards copper use parity per capita with the U.S.
Of course the rest of us, the other 1.8 billion people expected to be on this planet by 2050, aren't going to be easing up, we're still going to be using copper at prestigious rates while our eastern cousins play catch up.
Copper use parity isn't going to happen, it can't.
"The data also show that nations such as South Africa and China will need to increase their average urban per-capita copper stock-in-use by seven or eight times to achieve the same level of services as the developed countries if they use existing technology.
Is there enough copper to meet this potential requirement?
Concern about the extent of mineral resources arises when the stock of metal needed to provide the services enjoyed by the highly developed nations is compared with that needed to provide comparable services with existing technology to a large part of the world's population. Our stock data demonstrate that current technologies would require the entire copper and zinc ore resource in the lithosphere and perhaps that of platinum as well.Even a lower level of services could not be sustainedworldwidebecause a continuing supply of new metal is needed to make up for inevitable losses in the recycling of the metal stock-in-use.
Substitution has the potential to ameliorate this situation, but one should not automatically assume that technology will produce a satisfactory substitute for every service at an affordable price and precisely when needed.
...anthropogenic and lithospheric stocks of at least some metals are becoming equivalent in magnitude, that world-wide demand continues to increase, and that the virgin stocks of several metals appear inadequate to sustain the modern ''developed world'' quality of life for all Earth's peoples under contemporary technology...Do we really envision a developed world quality of life for all of the people of the planet...?" R. B. Gordon, M. Bertram, and T. E. Graedel, Metal Stocks and Sustainability
Despite what mainstream, swimming in the shallow end analysts say, copper is already in a very real, structural supply deficit. Most just don't know it.
Lets state the obvious:
- For over the last twelve years supply has struggled to keep pace with demand
- Metal supply is finite and subject to compounding demand from developing nations
- Metal production is highly cyclical, with intermittent peaks and troughs which are closely linked to economic cycles - declining production has historically been driven by falling demand and prices, not by scarcity
- Rates of production and amounts of reserves continually change in response to movements in markets and technological advances
- Most mineral resources will not be exhausted in the near future
- If energy was cheap and unlimited then recoverable resources would be unlimited
But
- Discovery and development is increasingly becoming more challenging and expensive
- Average ore grades are in decline for most minerals, yet production has increased dramatically
- Our most important metals are suffering from declining ore quality and rising extraction (ore is a different and inferior chemical or structural composition) costs
- Our prosperity has always been based on the fact that producing resources yielded more resources than it cost. However the cost of *energy is climbing, the amount used is climbing but the returns from energy expended is declining. Eventually the quantity of resources used in the extraction process will be 100% of what is produced
- Most older existing mines, the foundation of our supply, have increasing costs with production rates stagnating or even declining
- The rate of discovery is not keeping pace with the rate of depletion, let alone being higher
*Energy can be thought of as a proxy for labor, materials, energy and externalities - environmental, community impact etc.
Reserves
Each year, the U.S. Geological Survey (USGS) estimates the amounts of reserves: the quantities of mineral that can be economically extracted or produced at the time of determination.
World copper reserves are currently placed at around 630 Mt. When considered as just a single consolidated global number copper reserves seem large and adequate for several decades of production at 2012 levels.
Unfortunately most people do not take into consideration that these reserves are made up of many separate deposits, each of which has to be considered as a standalone and on its own merits.
The economic viability of the world's copper deposits are influenced by many factors that inevitably reduce the amount of copper that reaches production.
These factors are:
- Location
- Capital and operating costs
- Market conditions
Each of these deposits is also subject to geologic, engineering, environmental and political constraints that are always changing.
Many mines do not come online on time and the disruption rate, the amount of promised copper that fails to materialize is now as high as 8 percent - operating mines can suffer production stoppages/slowdowns or move into lower grade ore.
A long term structural trend became evident in the industry in 2012 - shortfalls in targeted production were characterized by a fall in grades and recoveries rather than unexpected disruptions.
Consider
- Average capital and operating costs for copper production capacity in new mines increased an average of 15% per year over the past 20 years
- From 2001 to 2012, the weighted-average head grade at 47 producing mines with comparable data declined by almost 30%
- The average ore grades of copper in new discoveries and developing projects is declining
- Significant deposits are now being found at greater depths or in more remote areas
- The 22 major copper producers, based on 2012 production levels, need to replace an average of at least 500,000 mt of copper reserves each year
Chile produces a third of the world's copper and has seen a seven fold increase in energy costs over the last ten years. CRU estimates Chile's copper production costs have risen 60 percent over the last seven years compared to a world average of 30 percent.
Chile is the world's top copper producer but the country as a whole is woefully short of power. The country's power generation capacity currently stands at 17,000 megawatts. It is estimated that the country will need at least 30,000 megawatts of power by 2020 to keep up with the demand, the increased demand coming primarily from mining projects. Unfortunately the government only plans to add 8,000 megawatts between now and 2020 and there is serious opposition to these plans from environmental groups who have, so far, been wildly successful by suspending several key projects and more than $22 billion worth of power investment.
Also because of a severe water shortage in the high desert, where most of the country's major copper mines are located, water must be pumped from the ocean to almost 800 meters above sea level and then pumped hundreds of kilometers to the mines, of course the seawater must also be desalinated.
Chile's copper production is in trouble, its ancient power grid is breaking down, electricity supply to the north, already inadequate, is threatened. No new mines, water is severely restricted and desalinization of seawater is required.
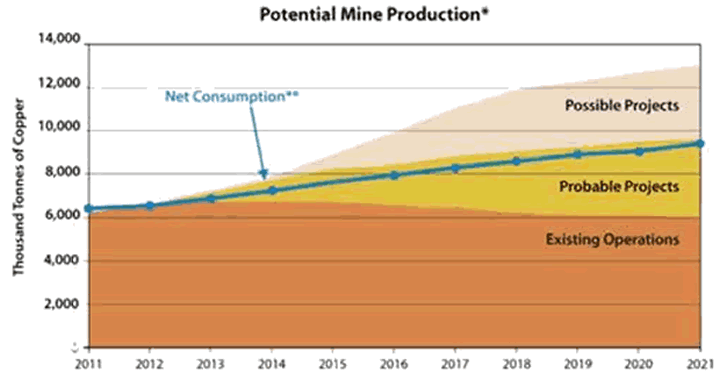
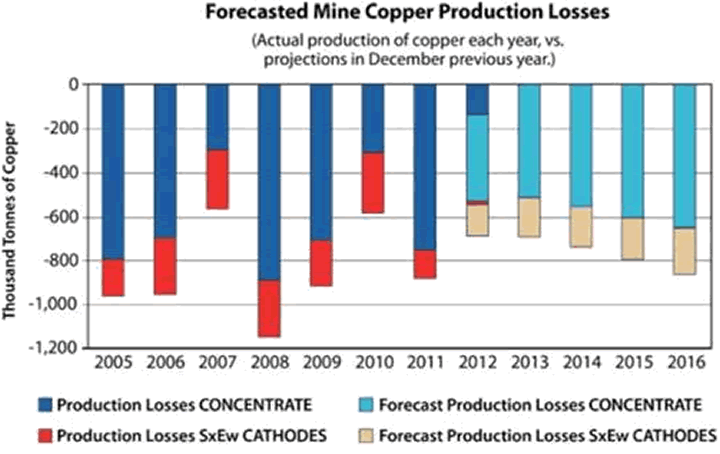
Over the past seven years, forecasts for world mine copper production have consistently exceeded actual production figures. An important take away from the graph below would be the decline in production from existing mines and how "Probable Projects" barely keep pace with expected consumption.
The chart below provides a graphic view of the decline in world average copper grades since 1985, plus the declining grade forecasts based on new mines under construction.
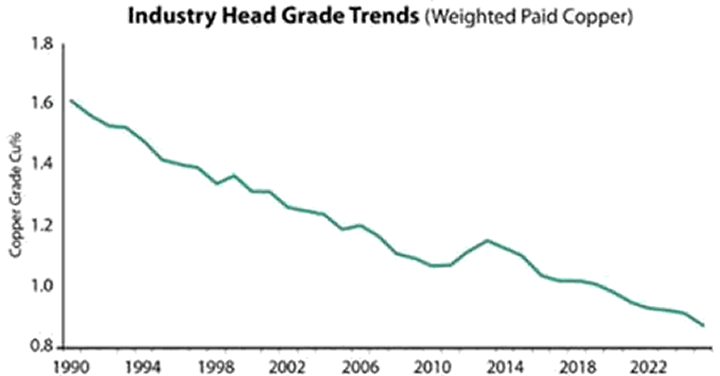
Source Brook Hunt
The metal content of copper ore has been falling since the mid 1990s. A miner now has to dig up an extra 50 percent of ore to get the same amount of copper. As grade drops the amount of rock that must be moved and processed per tonne of produced copper rises dramatically - all the while using more energy that costs several times more than it use to. With the lower grades of ores now being mined energy becomes more and more of a factor when considering economics.
1m metric tonnes of new copper supply is required to be produced each year to keep up with copper demand. The following chart graphically illustrates how current projections for future copper production may be optimistic.
Source A. Gonzales
Copper prices need to be significantly above marginal cost, in other words, prices need to stay high enough to provide miners with an adequate return on their investment for building today's much more expensive and riskier new mines. There is also a significant additional cost in keeping production constant year over year.
If copper does not stay well above miners marginal costs the much needed new mines will not be build.
Barclays said in February that the real expense of producing copper may be as much as 87 percent higher than back in 2007 due to higher labor and energy costs.
Rio Tinto says growth will continue to be a challenge for several reasons:
- An increasing proportion of potential new supply is located in riskier countries.
- More challenging environments subject to a lack of infrastructure imply an increase in the capital intensity of new projects.
- Recent supply has continued to underperform with decreasing grades and disruptions impacting production.
- Major causes of supply disruption will continue, these causes being; Technical complexity, Project delays, Labor strike action
Resource Nationalism & Political Risk
Resource extraction companies, because the number of discoveries was falling and existing deposits were being quickly depleted, have had to diversify away from the traditional geo-politically safe producing countries.
Resource nationalism is the tendency of people and governments to assert control, for strategic and economic reasons, over natural resources located on their territory.
Two Examples:
Indonesia's President Yudhoyono prohibited ore exports from Southeast Asia's largest economy. He's betting that investment and higher prices would more than offset job cuts and lost revenue from unprocessed ore shipments.
Zambia is Africa's largest copper producer (and wants to directly market its copper), in second place is the DRC. The copper-belt which straddles Zambia's and the Democratic Republic of the Congo's borders is being tied up for internal development by the two countries.
Conclusion
The world's exploding population, the massive shift from rural to urban, the growth of a very consumption minded middle class in developing countries, it's all happening now.
Add in finite, increasingly hard to source resources.
The effects will be felt long before we actually start to run out of copper and there will be severe consequences:
- Rising energy and commodity prices
- A decline in the global economy
- Civil unrest
Perhaps the two biggest reasons to get bullish on copper are one, the massive costs and risks involved in finding and opening new mines in often geo-political risky countries where a miners social license to operate is shaky at best.
And reason two would be regarding what's going on today regarding a loss of funding for junior exploration. Exploration funding for juniors being down plus 60% over the last two years does mean something no reserve replacement for miners. Those juniors able to survive and advance their projects to the point where a major becomes interested are going to fare very well.
Is the coming consequence of living in a resource finite world (and not believing anything shallow swimming analysts say about copper surpluses), on your radar screen?
If not, maybe you should.
By Richard (Rick) Mills
If you're interested in learning more about the junior resource and bio-med sectors please come and visit us at www.aheadoftheherd.com
Site membership is free. No credit card or personal information is asked for.
Richard is host of Aheadoftheherd.com and invests in the junior resource sector.
His articles have been published on over 400 websites, including: Wall Street Journal, Market Oracle, USAToday, National Post, Stockhouse, Lewrockwell, Pinnacledigest, Uranium Miner, Beforeitsnews, SeekingAlpha, MontrealGazette, Casey Research, 24hgold, Vancouver Sun, CBSnews, SilverBearCafe, Infomine, Huffington Post, Mineweb, 321Gold, Kitco, Gold-Eagle, The Gold/Energy Reports, Calgary Herald, Resource Investor, Mining.com, Forbes, FNArena, Uraniumseek, Financial Sense, Goldseek, Dallasnews, Vantagewire, Resourceclips and the Association of Mining Analysts.
Copyright © 2015 Richard (Rick) Mills - All Rights Reserved
Legal Notice / Disclaimer: This document is not and should not be construed as an offer to sell or the solicitation of an offer to purchase or subscribe for any investment. Richard Mills has based this document on information obtained from sources he believes to be reliable but which has not been independently verified; Richard Mills makes no guarantee, representation or warranty and accepts no responsibility or liability as to its accuracy or completeness. Expressions of opinion are those of Richard Mills only and are subject to change without notice. Richard Mills assumes no warranty, liability or guarantee for the current relevance, correctness or completeness of any information provided within this Report and will not be held liable for the consequence of reliance upon any opinion or statement contained herein or any omission. Furthermore, I, Richard Mills, assume no liability for any direct or indirect loss or damage or, in particular, for lost profit, which you may incur as a result of the use and existence of the information provided within this Report.
Richard (Rick) Mills Archive |
© 2005-2022 http://www.MarketOracle.co.uk - The Market Oracle is a FREE Daily Financial Markets Analysis & Forecasting online publication.