


Stock Market Important Week Ahead Medium-term
Stock-Markets / Stock Markets 2015 Jun 20, 2015 - 11:57 AM GMTBy: Tony_Caldaro

 Very interesting week. The week started off at SPX 2094. On Monday the market gapped down, hit the low for the week at SPX 2072, which was last week’s low, and then started to rally. By Wednesday, after a gap up opening, the SPX hit 2104. It then pulled back to SPX 2089, rallied to a higher high before the close, then gapped up again on Thursday. By Thursday noon the SPX had hit 2127. It then pulled back for the rest of the week ending at SPX 2110. For the week the SPX/DOW were +0.7%, the NDX/NAZ were +1.3%, and the DJ World index was +0.3%. On the economic front reports again came in with a positive bias. On the uptick: the NAHB, building permits, the CPI, the Philly FED, leading indicators, the WLEI, plus weekly jobless claims improved. On the downtick: the NY FED, industrial production, capacity utilization and housing starts. Next week’s reports will be highlighted by Q1 GDP, the PCE, and more reports on housing.
LONG TERM: bull market
For slightly more than eight months now the SPX has traded between 1973 and 2135, about an 8% range from the low. It closed this week at SPX 2110. The DOW has traded between 17,038 and 18,351, also about an 8% range. The NAZ however, has not traded in a range at all. It has gained 13% over the same period, and posted an all time new high on Thursday. While the cyclical SPX/DOW could not make much upside progress: the SPX confirmed three downtrends, and the DOW confirmed four downtrends during the eight month period. The growth NDX/NAZ only confirmed two downtrends, and have been in an uptrend since January. This explains why the cyclical SPX/DOW have not corrected much during their recent downtrend(s). The growth NDX/NAZ has been carrying them higher. More on this in the next section.
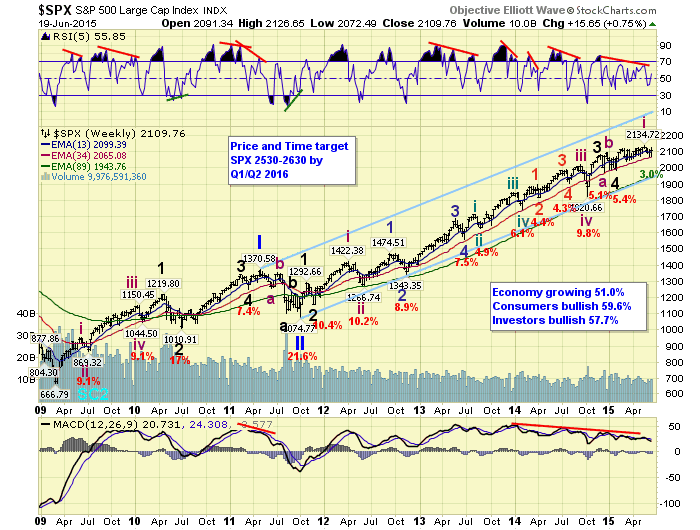
The bull market continues to unfold as the market has remained in an upper level consolidation. We continue to label this bull market as a five primary wave Cycle wave [1]. Primary waves I and II completed in 2011, and Primary III has remained in force since that October 2011 low. When it concludes, which we expect in 2016, the largest correction since 2011 will occur for Primary IV. Then Primary V will carry the market to all time new highs yet again before the bull market concludes. Currently we expect the bull market to last until the year 2017. Current targets for the year 2016 are on the weekly chart above.
MEDIUM TERM: downtrend trying to reverse into an uptrend
As we noted above, over the past 8 months the NDX/NAZ have had two downtrends, the SPX three, and the DOW four downtrends. If we jump ahead to January, when the NDX/NAZ has their last downtrend, we had labeled that a Major 4 low in the SPX/NAZ/NDX. The DOW should also display a Major wave 4, but it is carrying an alternate count. Since January the NDX/NAZ have remained in a uptrend, while the SPX recently confirmed a downtrend, and the DOW had confirmed two downtrends. This is very usual activity for the US market. Normally the SPX/NDX/NAZ all trend together, while the DOW throws in some additional trend reversals along the way.
When we compare the trends of the SPX/NDX/NAZ since 2009. We find they were in total sync from the beginning of 2009 through 2012. Then they shifted a bit out of sync during the big gains of 2013, only to re-sync again throughout 2014. Now they are out of sync again. When we review 2013 we find that the four indices did something similar to what they are doing now. At the end of Q2 2013 they all bottomed in a downtrend. Then about mid-way through Q3 the SPX/DOW had downtrends, the NDX/NAZ did not. Late in Q3 the DOW had another downtrend, the SPX/NDX/NAZ did not. Then in late-Q4/early-Q1 all four indices topped and headed into downtrends.
What all this implies is that the SPX/DOW may start impulsing again should the NDX/NAZ continue to uptrend higher. If that were to occur then all four indices would move in unison to much higher levels. In 2013, when this last occurred, the SPX was already up 20% for the year, and ended up 30% for the year. So far this year the SPX is barely up 2.5% for the year by mid-June. There is lots of room on the upside should the four indices realign in uptrends.
Also during that 2013 period the SPX/DOW had their smallest corrections, of the entire bull market, up to that point in time. Their recent corrections, should they have bottomed at Monday’s low, would be their smallest corrections of the entire bull market. Patterns look similar, corrections look similar, and six months of consolidation (+2.5). Interesting ingredients for a potential explosive move to the upside in the months ahead, with the NDX/NAZ leading.
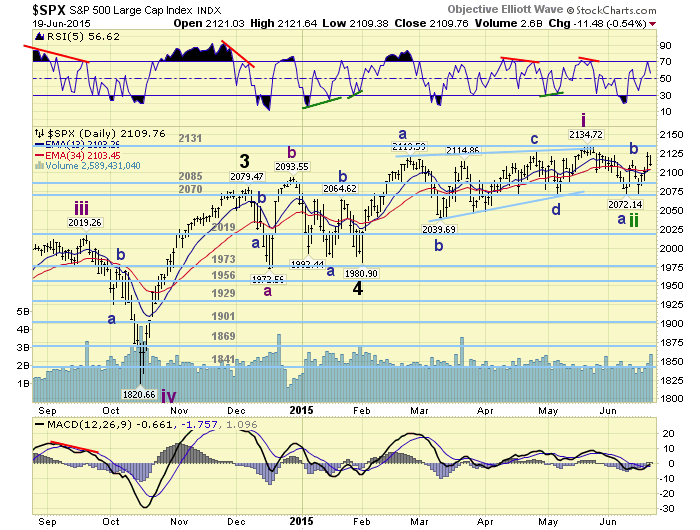
With this in mind, on Thursday we labeled Monday’s SPX 2072 low with a green tentative Intermediate wave ii. Should that actually be the low of the downtrend, the correction would have only retraced 38.2% of the entire uptrend advance from early-February until mid-May. Acceptable, but a bit odd for a leading diagonal triangle. Medium term support remains at the 2085 and 2070 pivots, with resistance at the 2131 and 2198 pivots.
SHORT TERM
For the past several months the SPX has been difficult to track as every rally since early March has been corrective. We tracked the waves as they unfolded and finally arrive at a leading diagonal triangle as noted on the daily chart above. The triangle actually cleared the upper trend line by a few points and then immediately retracted and headed lower. Two weeks ago the SPX confirmed the downtrend we had been expecting, while it continue to move in a choppy fashion. Since it was a diagonal triangle we expected a correction to at least the low of the B wave at SPX 2040, for a 61.8% retracement. But thus far it has only made a double bottom at SPX 2072 for a 38.2% retracement.
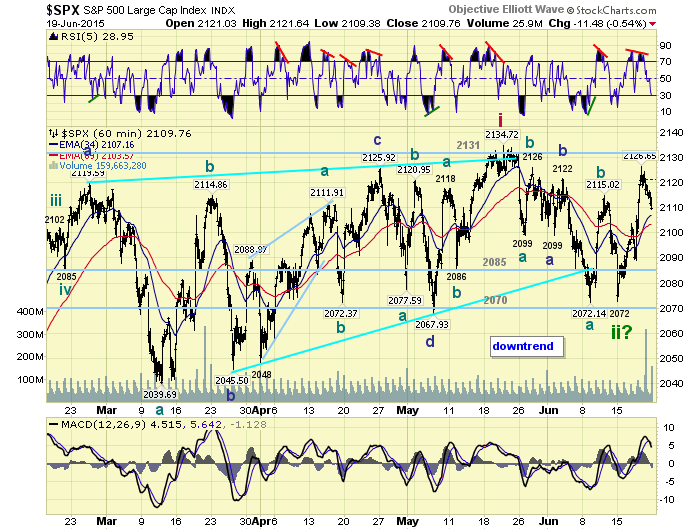
We had counted a three wave Minor wave A down to the double bottom at SPX 2099. Then a Minor B to SPX 2122. This was followed by a three wave Minor C, double bottom, to SPX 2072. After that the market soared to its highest level since the uptrend high at SPX 2135. This rally looks like a potential kick off to a new uptrend. Within the rally we have observed four waves thus far: 2104-2089-2127-2109. Should the market turn higher early next week and clear SPX 2127. Then we will have witnessed the first five wave advance since the early February low, which kicked off the last uptrend. Should the market continue its recent pullback and overlap SPX 2104. Then the entire rally would look corrective yet again. The two levels to watch going into next week: under 2104 and above 2127. Short term support is at SPX 2099 and the 2085 pivot, with resistance at SPX 2118 and the 2131 pivot. Short term momentum ended the week oversold.
FOREIGN MARKETS
Asian markets were mixed on the week for a net loss of 1.6%.
European markets were all lower for a net lost of 2.5%.
The Commodity equity group were mixed for a net gain of 0.7%.
The DJ World index is still in a downtrend but gained 0.3%.
COMMODITIES
Bonds are trying to uptrend and gained 1.0% on the week.
Crude remains in an uptrend but lost 0.4% on the week.
Gold is trying to uptrend and gained 1.6% on the week.
The USD remains in a downtrend and lost 0.8% on the week.
NEXT WEEK
Monday: Existing home sales at 10am. Tuesday: Durable goods, FHFA housing and New home sales. Wednesday: Q1 GDP (est. -0.2%). Thursday: weekly Jobless claims, Personal income/spending, PCE prices, and a speech from FED governor Powell. Friday: Consumer sentiment. Best to your weekend and week!
CHARTS: http://stockcharts.com/public/1269446/tenpp
After about 40 years of investing in the markets one learns that the markets are constantly changing, not only in price, but in what drives the markets. In the 1960s, the Nifty Fifty were the leaders of the stock market. In the 1970s, stock selection using Technical Analysis was important, as the market stayed with a trading range for the entire decade. In the 1980s, the market finally broke out of it doldrums, as the DOW broke through 1100 in 1982, and launched the greatest bull market on record.
Sharing is an important aspect of a life. Over 100 people have joined our group, from all walks of life, covering twenty three countries across the globe. It's been the most fun I have ever had in the market. Sharing uncommon knowledge, with investors. In hope of aiding them in finding their financial independence.
Copyright © 2015 Tony Caldaro - All Rights Reserved Disclaimer: The above is a matter of opinion provided for general information purposes only and is not intended as investment advice. Information and analysis above are derived from sources and utilising methods believed to be reliable, but we cannot accept responsibility for any losses you may incur as a result of this analysis. Individuals should consult with their personal financial advisors.
Tony Caldaro Archive |
© 2005-2022 http://www.MarketOracle.co.uk - The Market Oracle is a FREE Daily Financial Markets Analysis & Forecasting online publication.