Will the Malaysian Ringgit and Stock Market goes Terminal Velocity?
Stock-Markets / Stock Markets 2015 Aug 12, 2015 - 12:34 PM GMTBy: Sam_Chee_Kong
 It is a known fact that one of the hottest topics of discussion among Malaysians for past few months has been our Ringgit. Thanks to our current economic debacle, it helped raised our awareness of our economic situation. Despite the numerous propaganda engaged by our authorities assuring us of our economy’s resilience, it still failed to alleviate our suspicions. Cliché like high level of international reserves, current account surplus, solid domestic financial system and Ringgit reflecting our economic fundamentals were often used. Is it true that our economy is really that resilient and solid? This article aims to look into the current state of affairs of the Malaysian economy and also how it affects the Ringgit.
To begin with we shall look at the macro side of things. Unfortunately, all is not well with the current state of affairs in the world economy. A combination of falling oil and other commodity prices, strong dollar, stock market rout in China and record level of debts around the world has led the IMF to downgrade this year’s global economic growth to 3.2%. This represents the lowest growth rate since 2009. Slower growth means a smaller economic pie to share among all nations.
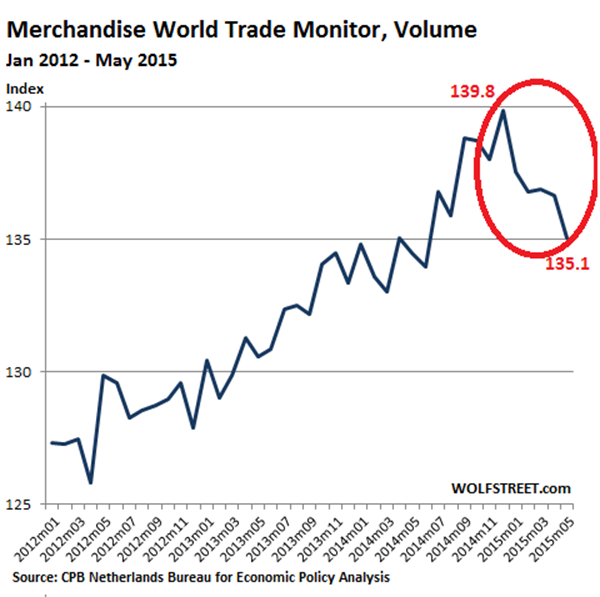
According to the CPB Netherlands Bureau of Economic Policy Analysis, the Merchandise World Trade Monitor index which covers the global import and export trade provides a good indication of the global economy. World Trade shrank 1.2% in May from the previous month. The index felled from 139.8 to 135.1 points or a 4.7 points drop. This is the sharpest and longest drop since the Global Financial Crisis in 2008. This can be shown graphically below.
To lower the volatility of the monthly analysis, CPM has a 3 monthly Trade momentum index. According to them the World Trade momentum had dipped to below -1%. This represents the slowest pace since the last Global Financial Crisis in 2009. Here’s the graph.
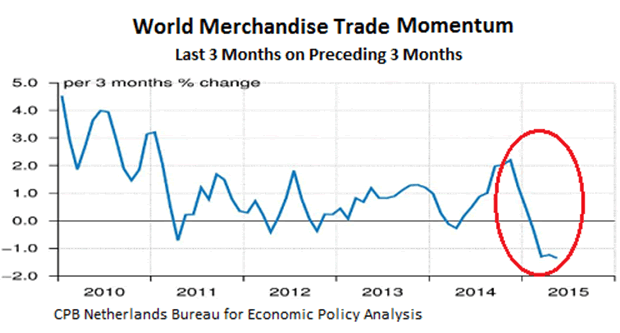
It also reported that the decline was widespread, import and export volumes declined in most regions and countries and in both advanced and emerging economies.
Another indicator that shows the global economy is in bad shape is the performance of commodity prices. When commodity prices decline sharply, it means that either there is an over-supply or weakening demand. A good indicator is the S& P GSCI or Goldman Sachs Commodity Index. It comprises of 24 major commodities from all sectors and thus provided a good indication of the overall performance of the commodity space. Below is the latest S & P GSCI chart.
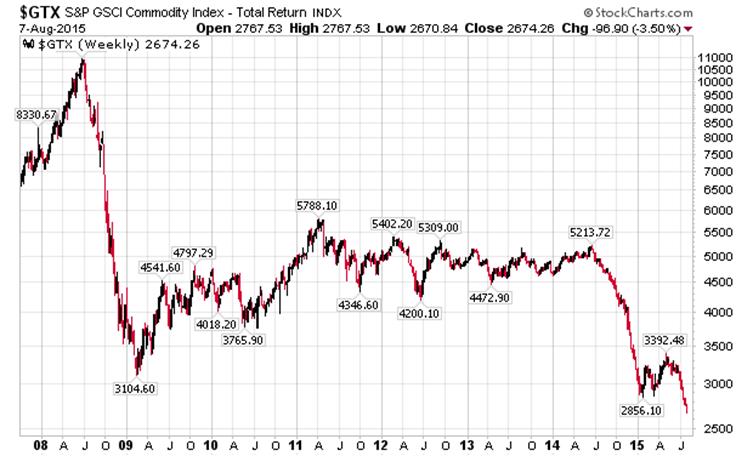
It can be seen from the chart above the index has crashed to its lowest point since the last Global Financial Crisis in 2008.
In view of this global economic malaise nations began to increase their competitiveness through competitive currency devaluation (beggar thy neighbor policy) to gain market share. The U.S started the ball rolling when it instituted the QE program in Jan 2009. As a result, the Federal Reserve balance sheet expanded and caused the dollar to decline. This helped to improve the terms of trade with its trading partners.
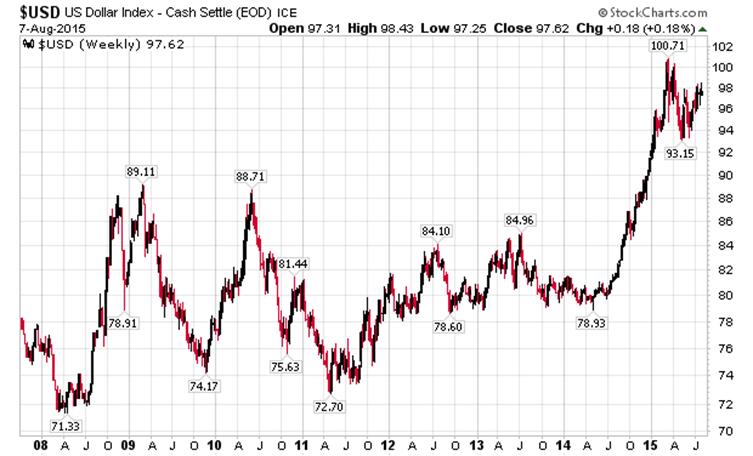
This led to other countries to join in the fray on competitive currency devaluation. Japan is next by devaluating its Yen to reflate its economy and so does Europe. As of July this year, there are more than 30 countries in one way or another joined the currency war. As a result this put an upward pressure on the Dollar and it has since appreciated more than 30%. The following USD index chart shows the movement of the USD since 2008.
Malaysia can be considered as one of the most vulnerable economy that is susceptible to both internal and external exposure. This means our economy is elastic to sudden capital outflow which can cause detrimental damage to our economy. Below I present the External and Domestic Exposure Heat Map by Morgan Stanley.
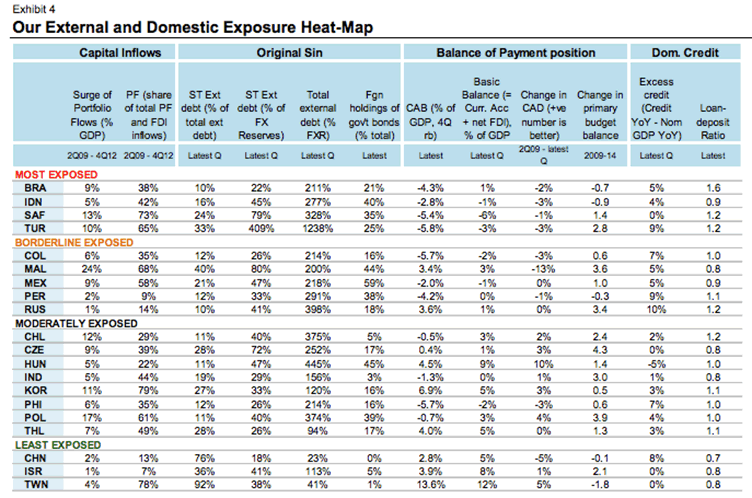
As can be seen from above between 2nd Quarter of 2009 and 4th Quarter of 2012 Malaysia recorded the highest surge in Portfolio flows, 24% to be exact. On top of that out of the total FDI inflows between that timeframe 68% are of Portfolio inflows. That means most of them are short term capital inflow while the 32% went into long term investments such as building factories or expanding existing facilities. Short term capital inflows can turned outflow in a heartbeat whereas long term capital inflows are more difficult to reverse as their investments ‘are stuck on the ground’.
The second point to note is that 40% of our external debt is short term in nature meaning they can reverse flow at any moment.
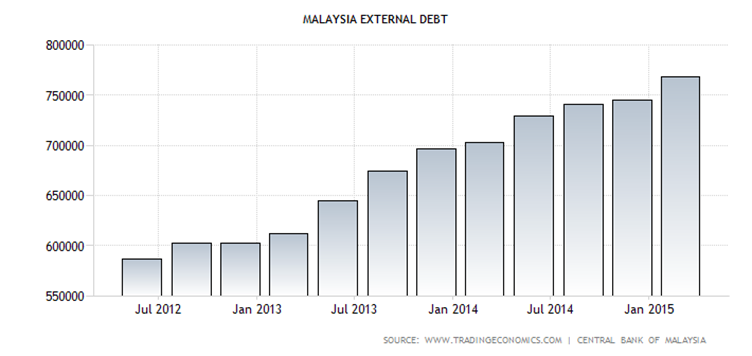
As of March this year our external debt ballooned to RM 768 billion from RM 744 billion in December 2014. Since our foreign exchange reserves have dropped to USD 96.7 billion in July the ratio of our External Debt/FX Reserve now exceeded 200%.
With 40% of our debt is short term in nature, thus it can be said that there are about RM 300 billion in short term debt that are vulnerable to reverse flow. The question is, say if only 50% (RM 150 billion) of the short term funds decided to rush for the exit can Bank Negara counter this move? What chance are we able to defend the Ringgit with just USD 96.7 billion left in the Foreign Exchange Reserves? Please do not forget that from the table above, our Short Term Debt/ FX Reserve stands at 80% which is the second highest after Turkey. Turkey is the biggest Emerging Market economy to succumb to the current financial crisis. The Turkish Lira has dropped to the all-time low to 2.81 against the USD amid political crisis in the country. It has dropped 60% against the USD since 2008. See the chart below.
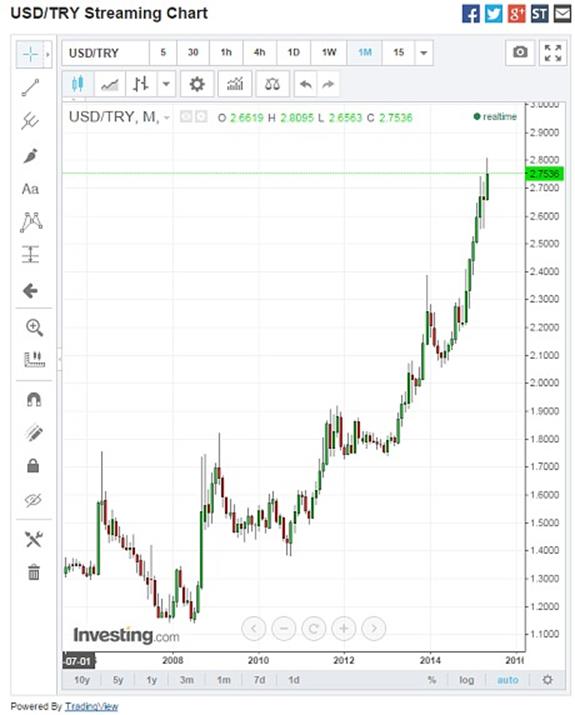
The Turkish Central Bank has tried to direct intervene in the forex market but failed leaving its reserves with just $35 billion. Similar to Malaysia, Turkey also ran budget deficit for years and had to rely on external financing. Further devaluation meant it will be even harder for them to pay off their dollar debt.
The Turkish political crisis also led the government led by Mr Erdogan to implement erratic policies in order to tighten his grip on his opponents. This includes political pressure on the central bank to intervene and purging of prosecutors, judges and whistleblowers.
The third point to note from the table above is that foreign holding of Malaysian bonds stands at 44%. This is the third largest after Hungary and Mexico. Malaysia also has one of the largest LCY (Local Currency) bonds in Asia after Japan and Korea. It is close to 100% to GDP or about RM 1 trillion. Below is the breakdown.
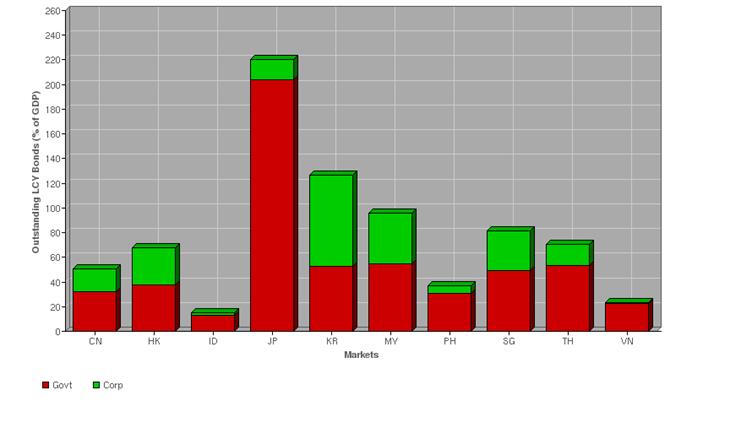
Who are on the losing side when they invest in local currency bonds especially when the Ringgit is depreciating? Well foreign bond holders will be on the losing side. This is because when they exit the bond market they will be getting less USD when they convert their Ringgit to the USD. To ensure the bondholders do not exit at the same time, interest rates will have to rise as a form of compensation. The price of bonds is inversely related to the yield. When happens when foreign investors start selling? The price of bond will go down and the yield will go up. The nightmare every country has is a ‘bond run’. This happens when every bond holder starts rushing for the exit and this will cause a selloff in the bond market which in turn caused interest rates to rise substantially.
By now it is a known fact that our Ringgit has been on the downtrend since last year only recuperating some losses beginning of this year. However the slide begins again and it is likely that we have yet to see the worse. The following chart denotes the exchange rate between the USD and our Ringgit. As can be seen it is now fast approaching the 4.00 psychological level that was set back in 1998 during the Asian Financial Crisis.
USD/MYR chart
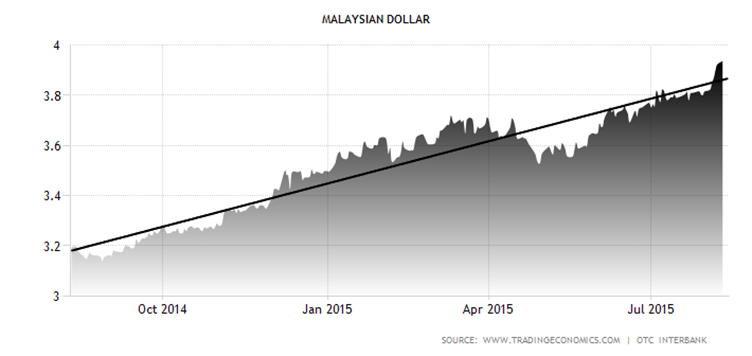
Bank Negara Malaysia has also been involved in the intervention of the Malaysian Ringgit through open market operations by selling the Dollar to prevent further slide of the Ringgit. What supposed to be an orderly or controlled devaluation of the Ringgit by Bank Negara became unmanageable especially after May this year. This also coincides with the onset of our political crisis. This can be shown by the sharp decline of our Foreign Exchange Reserves in the following chart.
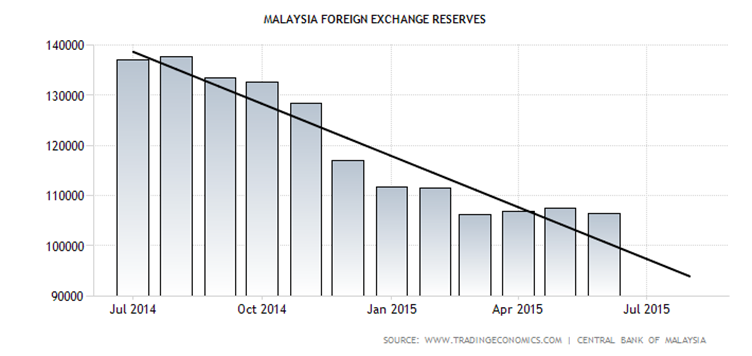
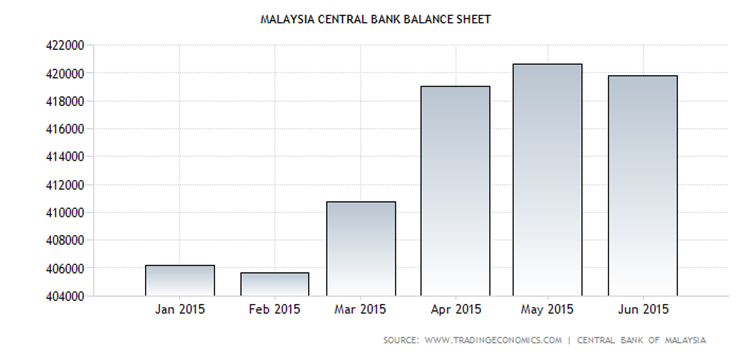
Our Foreign Exchange Reserves peaked at $155 billion in August 2011 but has since been declining rapidly. In July 2015, our Foreign Reserves declined to $96.7 billion, a drop of $58 billion from the peak. We have been recording Balance of Payment surplus for the past many years and by right the excess Dollars should be added into the Foreign Exchange Reserves. Yet we are seeing dwindling reserves and one explanation is some of the reserves are being used for open market operations to support the Ringgit. This can be further supported by the expansi
on of Bank Negara’s Balance Sheet as shown below.
Wrapping Up
In wrapping up, from above we know that Malaysia is now one of the most vulnerable countries subjected to capital outflows. This is mainly due to our large exposure to short term debts. With Short Term Debt/ FX Reserve at 80% and Short Term Debt/ Total Debt at 40% and dwindling foreign reserves. In short, we are running on wafer thin safety margin. With Turkey, Russia and Brazil already admitted to defeat in the Currency war, Malaysia’s effort to prop up the Ringgit by selling the Dollar will end up a loser game. Brazil has since gone to the next level of protectionism by enlisting embargo and tariffs. If our political crisis is not solved within a shortest period of time, our economy, exchange rate and stock market will risk a rapid decline soon.
In tradespeak, this amounts to terminal velocity. Terminal velocity decline in any asset price is due to the animal spirits (ideas and feelings) among us. As a normal investor we are all prone to the loss aversion which is a psychological reaction to the market behavior. This refers to our tendency to avoid losses rather than acquiring gains. In normal conditions investors tend to buy when stock price increases and sell when stock price decreases. This will have the tendency to cause a price change in one direction. This will cause a feedback loop where selling begets selling which is also known as price-to-price feedback. This can cause a drastic drop in the asset price as it will lead to panic selling. Eventually it will cause a crash in the asset price. This can happen to our Ringgit when foreign investors start dumping our Bonds and Stocks as it is happening now.
by Sam Chee Kong
cheekongsam@yahoo.com
© 2015 Copyright Sam Chee Kong - All Rights Reserved
Disclaimer: The above is a matter of opinion provided for general information purposes only and is not intended as investment advice. Information and analysis above are derived from sources and utilising methods believed to be reliable, but we cannot accept responsibility for any losses you may incur as a result of this analysis. Individuals should consult with their personal financial advisors.
© 2005-2022 http://www.MarketOracle.co.uk - The Market Oracle is a FREE Daily Financial Markets Analysis & Forecasting online publication.


