


Full on Crash Alert for Major World Stock Markets...
Stock-Markets / Financial Crash Aug 21, 2015 - 02:55 PM GMTBy: Clive_Maund

 There are various reasons, both fundamental and technical, to believe that a market crash is almost upon us. This crash will affect virtually all world markets, including and especially the big Western Markets which have thus far escaped the devastation already afflicting the developing markets. Here we are going to focus on US markets, but they will all get taken down - European markets including the UK, and Far Eastern markets such as Hong Kong and Japan.
The fundamental reasons for a market crash now are big and obvious - the ravages of deflation and depression brought about by extremes of debt which must cut into corporate profits - in Japan the debt situation is now hopeless, the Sovereign debt crisis set to crush Europe and probably destroy the euro, the collapse and implosion of the monstrous debt fuelled bubble in China which is already underway, an accelerating currency crisis in the Far-East exacerbated by the recent Chinese devaluation of the Yuan, and the collapse also already underway in Emerging Markets. Given that US markets have been driven to giddying heights by the combination, among other things, of maxed out margin debt and stock buybacks, it is clear that a crash of perhaps unprecedented proportions in on the cards. So much for the fundamentals, since we are more concerned with timing, we now turn to consider the latest charts.
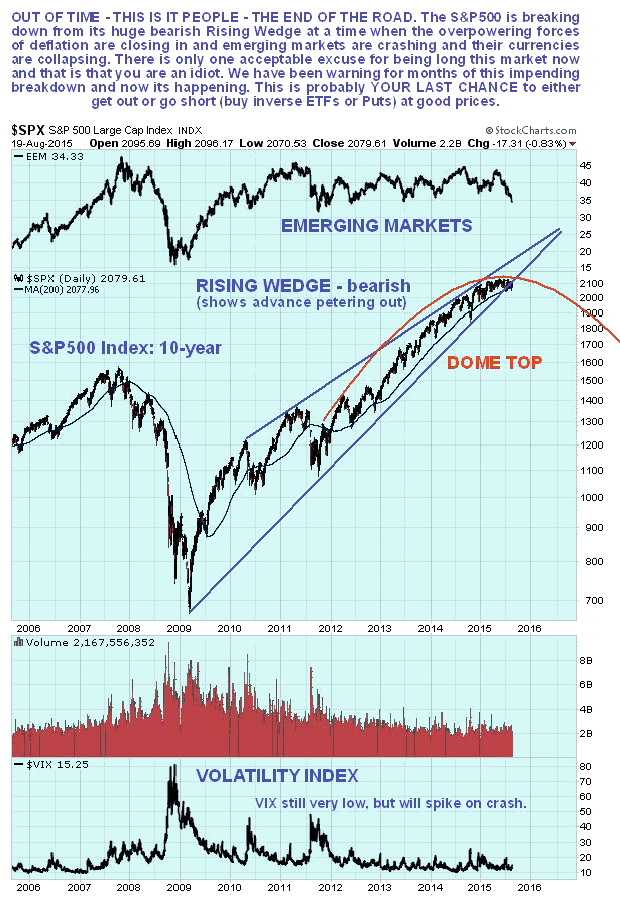
We'll start with the 10-year chart for the S&P500 index, on which we see a very bearish setup, where after a multi-year bullmarket, the index is now breaking down from near the apex of a giant bearish Rising Wedge, having been capped by a large Distribution Dome. It is now in position to plunge, and this is made more likely by the rapidly weakening Emerging Markets, shown at the top of the chart, and the Volatility Index, or VIX, shown at the bottom of the chart, which has been at a low level for a long time, indicating a high degree of complacency, makes it unlikely that the market will drift lower - it is much more likely that it will plunge, as immediately it becomes clear that the game is over and the trend has changed there will almost certainly be an almighty stampede for the exits.
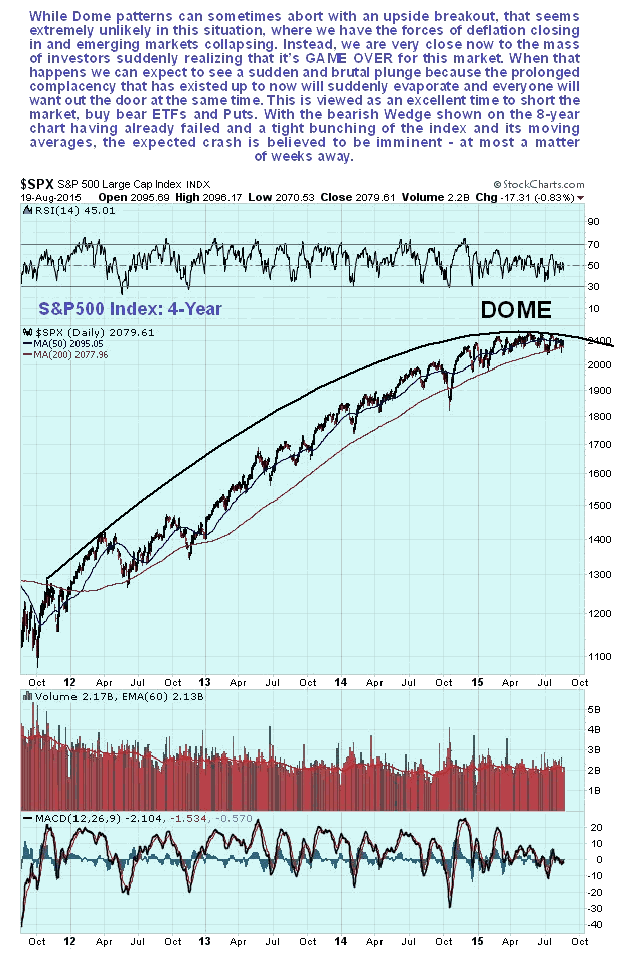
On the 4-year chart we can see the origins of the Dome pattern more clearly, and how the market has been rounding over beneath the top of this Dome all this year, which is now starting to force it lower. These Dome patterns sometimes abort with an upside breakout, but that looks highly unlikely given the rapidly worsening fundamental situation.
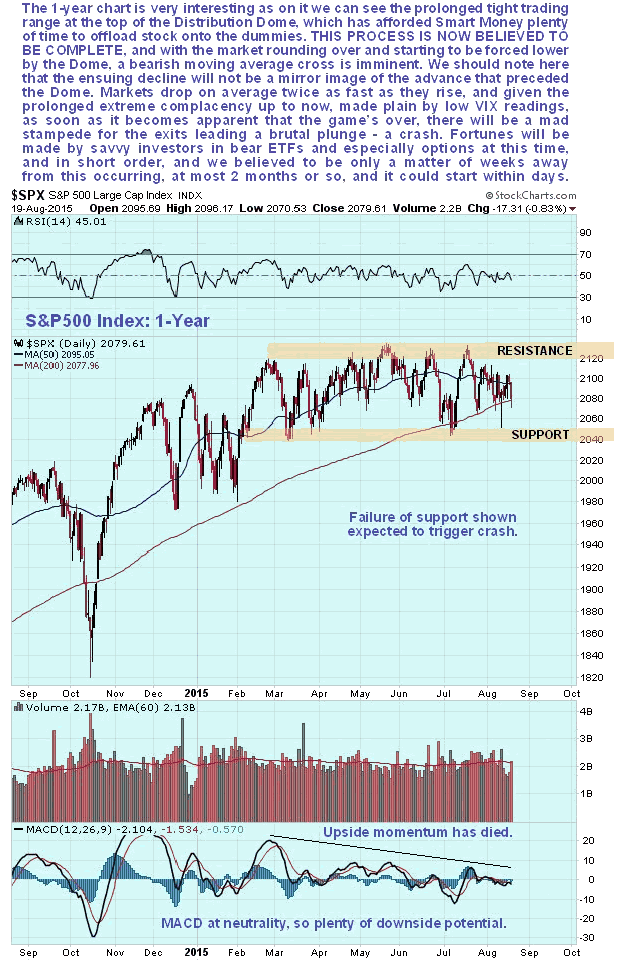
The 1-year chart shows recent action in more detail. On this chart we can see how upside momentum has fizzled out completely this year as a tight choppy trading range has developed sandwiched between the support and resistance levels shown. This trading range has afforded Smart Money all the time it has needed to offload stock onto the dummies, who are now left "holding the bag". With distribution now believed to be complete, as symbolized by the tight bunching of the index and its moving averages, everything is in place for a severe bearmarket phase to begin, and it is particularly ominous that the 50-day moving average is now closer to breaking down through the 200-day than it has been for a long time - as we can on the 4-year chart, it would be the 1st time that this has happened since 2011 - nearly 4-years. This is the so-called "Death Cross" because it frequently signals a major change of trend. Failure of the support at the bottom of the range at 2040 is likely to trigger the crash phase.
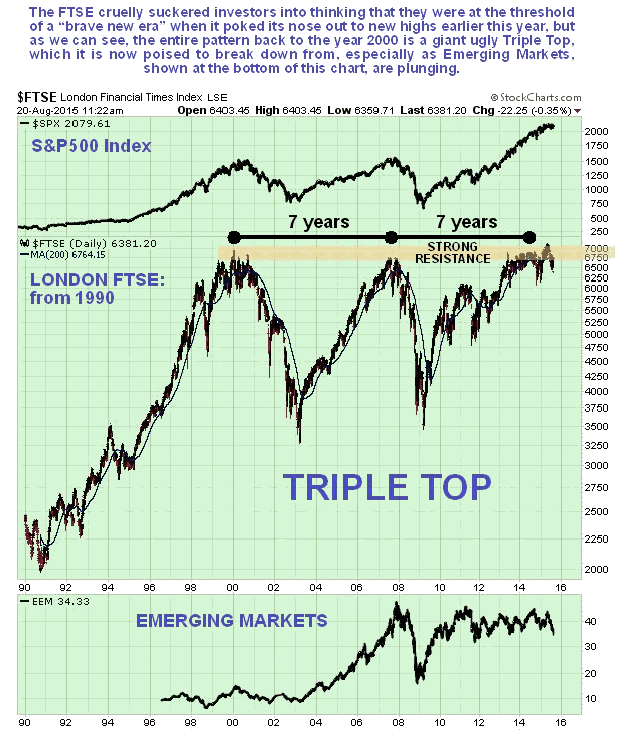
It's worth taking a sideways look at another big Western market, the London market to see if a similar topping pattern is evident. It is - on the long-term chart for the London FTSE index going back to the start of the 90's we can see that a giant epochal Triple Top is completing. This market is believed to be "done for", particularly since the UK is just another debt bubble, and the Emerging Markets, shown at the bottom of the chart, are already plunging. It's another good market to short.
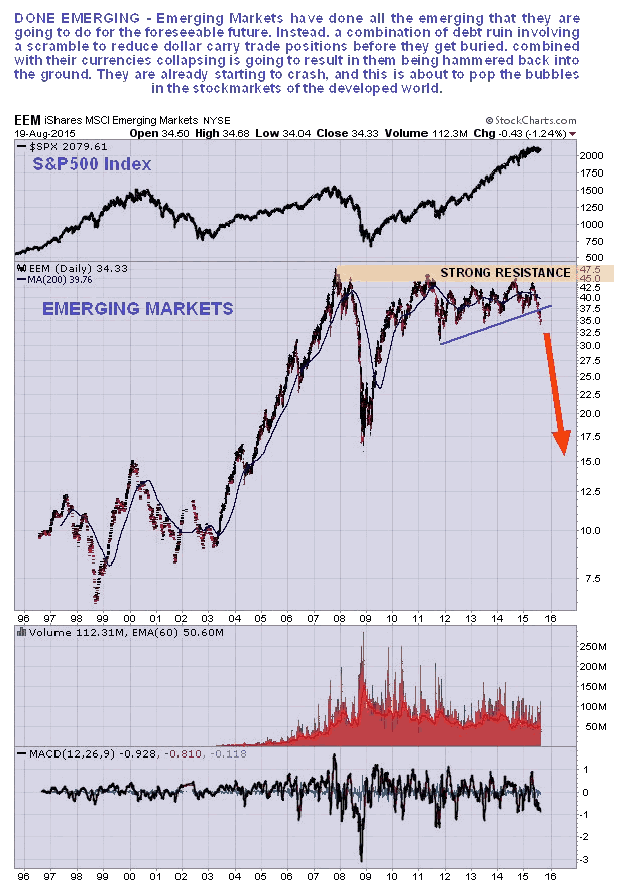
Finally we will take a brief look at the chart for Emerging Markets themselves, using the EEM ETF as a proxy. As we can see on the long-term chart for EEM, a huge top pattern has formed between late 2007 and the present beneath a clear line of resistance. This presumably would have been a fairly uniform top pattern had it not been for the 2008 market crash, which resulted in it plunging before quickly recovering all its losses the following year. The whole pattern looks like a misshapen giant Double Top, not unlike the long-term copper chart, incidentally. It has already broken down from a potential Ascending Triangle and is starting to drop away fast and looks set to crash, with the ball being kicked downhill by the recent plunge in the Chinese market and the devaluation of the Yuan. Emerging Market currencies are already crashing and burning, and Emerging Markets themselves look set to do likewise, which will surely not be a bullish influence on major Western Markets.
Further reading: the following articles by other writers are certainly well worth reading - The Collapse Has Already Begun by Michael Snyder, Doomsday clock for global market crash strikes one minute to midnight as Central Banks lose control by John Ficenec and last but not least this very insightful article by David Stockman which is a little dated but still very relevant Why the Dollar Is Rising As The Global Monetary Bubble Craters. The fact that the 2nd of these articles has appeared in a mainstream publication like the UK Telegraph is a sign that Big Money is now comfortably in position to benefit from the crash.
A major stockmarket crash probably worse than 2008 looks imminent, and by imminent we mean probably within weeks, possibly as far as out as two to three months, but perhaps within days. A break below 2040 on the S&P500 Index may trigger it. Virtually all stocks on the broad market should be sold, and bear ETFs and possibly Puts bought before the breakdown. We have already lined up suitable bear ETFs, both unleveraged and unleveraged on the site in PREPARING FOR THE CRASH - BEAR (INVERSE) ETFs SHORTLIST, INCLUDING LEVERAGED and will be looking at a range of large cap stock Put options very soon.
By Clive Maund
CliveMaund.com
For billing & subscription questions: subscriptions@clivemaund.com
© 2015 Clive Maund - The above represents the opinion and analysis of Mr. Maund, based on data available to him, at the time of writing. Mr. Maunds opinions are his own, and are not a recommendation or an offer to buy or sell securities. No responsibility can be accepted for losses that may result as a consequence of trading on the basis of this analysis.
Mr. Maund is an independent analyst who receives no compensation of any kind from any groups, individuals or corporations mentioned in his reports. As trading and investing in any financial markets may involve serious risk of loss, Mr. Maund recommends that you consult with a qualified investment advisor, one licensed by appropriate regulatory agencies in your legal jurisdiction and do your own due diligence and research when making any kind of a transaction with financial ramifications.
Clive Maund Archive |
© 2005-2022 http://www.MarketOracle.co.uk - The Market Oracle is a FREE Daily Financial Markets Analysis & Forecasting online publication.