


Are There Stock and Financial Markets Investing Opportunities For The Remainder Of 2015
Stock-Markets / Financial Markets 2015 Sep 01, 2015 - 12:30 PM GMTBy: SecularInvestor

 The markets were ‘shockingly’ interesting last week. But what investing opportunities have been created by the recent ‘shock’?
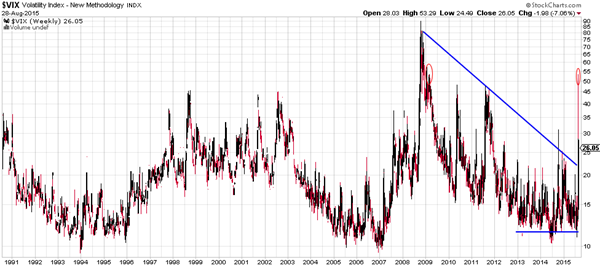
The seriousness of last week’s shocking action in the market is shown by the volatility index, which posted its second highest reading since its inception in 1990. This is comparable to the great crash of 2008/9.
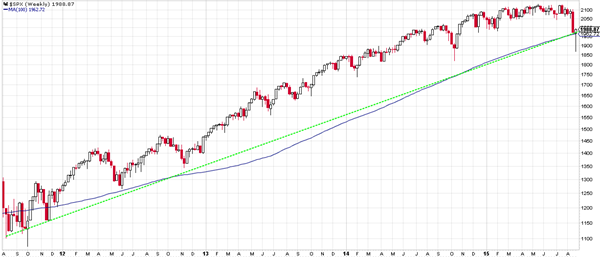
There has been much discussion regarding technicals and charts. Instead, we prefer to focus on the trend, particularly the uptrend since 2012, without analysing the myriad of technical indicators. The weekly chart of the S&P 500 shows the uptrend is still intact (green dotted line below), although the S&P 500 arrived at a critical ‘make-or-break’ point. The weekly close on the trendline, only a couple of points above the 100 week moving average, suggests that all scenarios are still open.
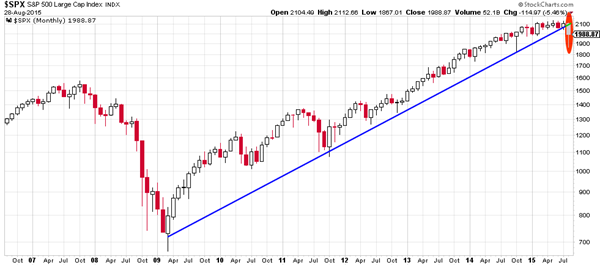
However, the bad news for stock investors is that the 2009 uptrend is violated on the monthly chart, the most relevant chart type for secular trends. August is setting up for the first monthly close below the 2009 trendline. The odds now favor a continued decline, unless proven otherwise. Structural support comes in at the 2007 top, at 1600 points for the S&P 500, which is 19% below today’s levels.
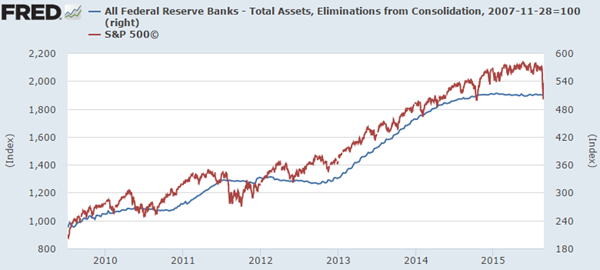
Our preferred indicator for the stock market is its correlation with the Federal Reserve balance sheet. Since 2009 it has been a very reliable indicator, as shown by the chart below. Uncoincidentally, the Fed’s balance sheet stabilized in late 2014, when the process of ‘Tapering’ was completed. Since then, the stock market has traded sideways following the Fed’s balance sheet.
That correlation suggests a weak future for stocks, unless the Fed intervenes with monetary stimulus, which was not what the Fed hinted during their recent announcements. Based on the Fed’s balance sheet and monetary decisions, one can assess whether U.S. stocks will offer opportunities or whether a cautious stance is preferable.
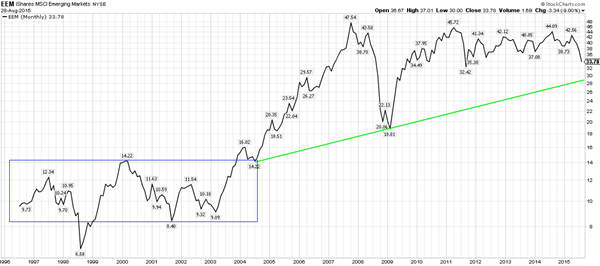
Global stock markets have fallen much more than in the U.S. In particular emerging markets are now down 39% since it peaked in June, triggered by the crash of the Shanghai stock exchange. How much more downside is likely? Based on the trend started in 2004, after a long consolidation period, we think the downside is another 10 to 15%. Knowing that this year’s correction in the emerging market index is already 22%, this could be an interesting space for opportunities in the coming months.
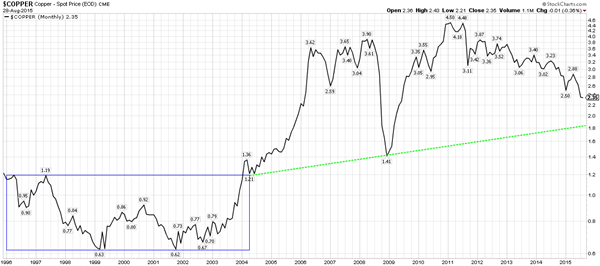
The correction in emerging markets is also reflected in copper’s spot price. As a leading indicator, Dr. Copper lost 18% of its value from its 2015 top until today. It is no coincidence that the secular trend on copper’s chart is similar to that of the emerging markets; even the percentage decline is comparable. Based on the secular trendline, the downside in copper is another 19% before it hits major support. We view this as a confirmation of the emerging markets forecast discussed above.
That brings our focus to commodities in general. Driven by the collapse of key commodities oil and copper, the damage in the commodity space has been huge. Since the 2011 top, the CRB index, a proxy for the commodity complex, has lost 45% of its value. Year-on-year, the index is 37% lower.
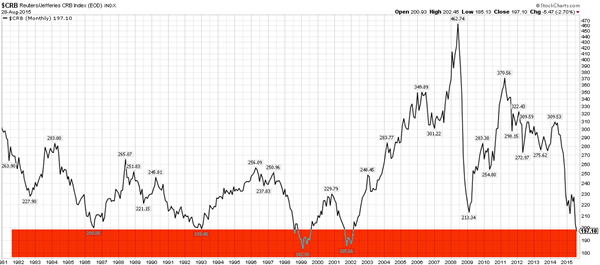
The good news for commodities is that they are hitting a secular bottom, as indicated by the red bar on the chart above. The 4 decade low is only 7% below today’s level. This seems like another area where opportunities will arise in the coming months.
What about gold? Is an opportunity developing? The most interesting trend on the longer term gold chart is the deceleration of gold’s decline. Although the trend remains down, with a clear formation of lower lows, the decline is slowing. Also note that the lows have occurred in an orderly manner, not comparable to the aggressive declines of April and June of 2013. This indicates selling pressure is fading and that gold is bottoming. The gold mining industry has been slaughtered, so the miners that survive this deep crisis will outperform once the tide turns in precious metals. Although a trend change takes time, we believe that opportunities are manifesting in gold, silver and miners.
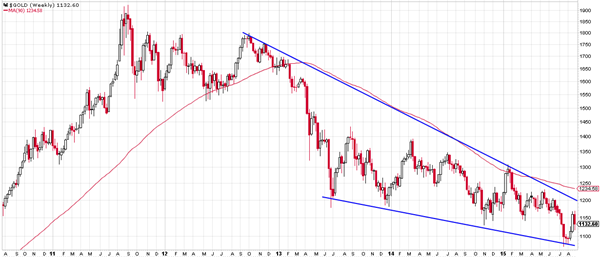
Note on gold’s chart that the wedge is now ripe to change its trend. The quality of the wedge is high, with at least 3 tests at each side of the pattern. We wouldn’t be surprised at all if gold would start a secular breakout later this year. Mark our words!
We have purposely left currencies out of our analysis. Given the degree of central bank currency interventions, we believe the risk is too high for secular investors.
The conclusion regarding the markets is that the heavily sold emerging markets and some commodities will likely continue their decline, but they are setting up a major bottom in the not-too-distant future, potentially after more capitulation. Stocks in the U.S. are sitting at major support, so current price levels must be watched closely, as well as the monetary policy of the U.S. Fed, given the strong correlation between the Fed’s balance sheet and U.S. stock indices. Although gold is still declining, it is signaling an exhaustion of its decline and potentially an breakout from its downtrend.
Secular Investor offers a fresh look at investing. We analyze long lasting cycles, coupled with a collection of strategic investments and concrete tips for different types of assets. The methods and strategies are transformed into the Gold & Silver Report and the Commodity Report.
Follow us on Facebook ;@SecularInvestor [NEW] and Twitter ;@SecularInvest
© 2015 Copyright Secular Investor - All Rights Reserved Disclaimer: The above is a matter of opinion provided for general information purposes only and is not intended as investment advice. Information and analysis above are derived from sources and utilising methods believed to be reliable, but we cannot accept responsibility for any losses you may incur as a result of this analysis. Individuals should consult with their personal financial advisors.
© 2005-2022 http://www.MarketOracle.co.uk - The Market Oracle is a FREE Daily Financial Markets Analysis & Forecasting online publication.