


Peak Food Island Earth
Commodities / Agricultural Commodities Sep 29, 2015 - 02:49 PM GMTBy: Ned_W_Schmidt

 Island Earth is our latest article on the concept of Peak Food, which was introduced in two previous articles. We do recommend reading those other two articles in conjunction with this one: Peak Food 2 and Peak Food, An Introduction
Below we will observe that Island Earth is a major component of Peak Food. Reality is that Island Earth, combined with a myriad of other factors, has serious negative implications for our world's ability over time to satisfy human demand for food at affordable prices. Today, many ignore the reality of Peak Food. For the farsighted investors, Peak Food offers an investment opportunity that can provide benefits for generations.
Peak Food was the name given to the results of research by Seppelt, et al(2014) published as "Synchronized peak-rate years of global resources use" in Journal of Ecology and Society. That research was made popular in "Have we reached 'Peak Food'? Shortages loom as global production rates slow" (Bawden,2015). For that reason we creditBawden with the term Peak Food.
As we have mentioned previously, Thomas Malthus, author of An Essay on the Principle of Population(1798), lived in England. The dominant geographical feature of England is that it is an island. Malthus made some very obvious observations about island England. The size of the land area is fixed, and does not change. Further, only part of that land area is suitably for the raising of food for human consumption, and that for all practical purposes the agricultural area cannot be materially altered. For example, the top of a mountain is not suitable for raising wheat.
We have noted that the Earth is an "island" in the universe. Just as water is the boundary for island England, space is the boundary for Island Earth. The surface area of the Earth is fixed. We are not going to wake up ten years or a hundred years or a thousand years from now to an Earth that is larger. In the geological short-term, the resources of the Earth, including land area, are fixed. That reality does not mean that some natural resources may exist far in excess of those that humans can consume in the "short-term".
Agricultural area is that land which can support the production of Agri-Foods of some kind. Some of that land is suitable for crops like corn and rice while some is only suitable for growing cattle or goats. Other land might be best used for growing walnuts, apples, or olives. Agricultural area is one term used to describe all that land that can be used for the production of some type of agricultural product, from soybeans to sheep.
Size of total land area on Earth is fixed. A more relevant measure though for our purposes is that land which can be used or could be used to grow food, or actual agricultural area. Sometime in the future world may be able to make land we cannot today use to produce food able to do so or we might be able to "farm" the oceans. However, time frames for such events are not relevant today, tomorrow, or in the next decade.
The following graph plots the total agricultural area of the world. Data used to produce this graph comes from the U.N. Food and Agriculture Organization(FAO) data base(FAOSTAT). Scale on left axis is millions of hectares(2.47 acres), and begins in 1961.
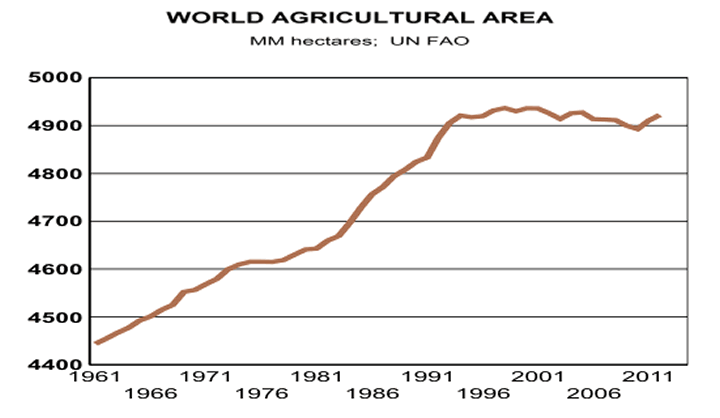
As can be observed in chart, worldwide, total agricultural area has ceased expanding, and a peak is in place. Our world's agricultural area began to cease expanding in 1994 and an absolute peak was put in place in 2000. Since the year 2000 world agricultural area has not expanded, and actually has shrunk slightly. Given a plethora of land management issues, from irrigation to inadequate maintenance of organics as well as other issues, we expect world's agricultural area to continue shrinking. We consider this chart strong validation of our Agri-Food thesis.
Implications of this situation should not be minimized, or dismissed. Growth in global food production is the product of percentage change in agricultural acreage times the increase of per acre production, or productivity growth. If global agricultural acreage is not expanding, the only source of increased food production is through an increase in productivity per acre.
If the size of the agricultural land on Earth has indeed reached a limit, at a minimum for the life span of most investors, then several implications are discernable. First, quite obviouslyAgri-Land values should rise over time, subject to short-term cycles. Second, as consumption of food rises due to increasing demand from China, Asia-Pacific region, and India. prices for Agri-Foods will increase over time. Thirds, those businesses, Agri-Equities, that create and sell technology and/or services to increase productivity of Agri-Land and farmers will benefit from a rising revenue stream. Investors participating in these areas should be well rewarded.
In our second article on Peak Food we introduced some of the relevant conclusions on peak years for production of important Agri-Foods. In the table below we have extracted from that previous table a selection of Agri-Foods. Second column is the estimate of Peak Year by Seppelt, et al(2014). Third column is absolute peak year of total world production for that Agri-Commodity if one is evident in the data. Final column is size of current crop relative to the crop in the absolute peak year.
Peak Production Summary*
(Revised: 25 Sep 2015)
| Crop | Statistical Peak Year of Production Gain |
Absolute Peak Year Total Production** |
Current Crop Year vs. Abs. Peak Year |
| World Agricultural Area | No Estimate | 2000 | - 0% |
| Canola | 2009-2011 [Est.] | 2014 | -10% |
| Corn | 1985-2007 | 2015 | - 3% |
| Cotton | 2004-2011 | 2012 | -15% |
| Rice | 1988-2008 | 2015 | - 13% |
| Soybeans | 2009-2011 | 2016 ? | |
| Wheat | 2004-2011 | 2016 ? |
References:
Bawden, T. (28 January 2015).Have we reached 'Peak Food'? Shortages loom as global production rates slow. The Independent.
Malthus, T. (1798). An Essay on the Principle of Population. Amazon Kindle.
Seppelt, R., et al. (December,2014). Synchronized peak-rate years of global resources use. Journal of Ecology and Society.
Ned W. Schmidt,CFA is publisher of The Agri-Food Value View, a monthly exploration of the Agri-Food Super Cycle, and The Value View Gold Report, a monthly analysis of the true alternative currency. To contract Ned or to learn more, use either of these links: www.agrifoodvalueview.com or www.valueviewgoldreport.com
Ned W Schmidt Archive |
© 2005-2022 http://www.MarketOracle.co.uk - The Market Oracle is a FREE Daily Financial Markets Analysis & Forecasting online publication.