Fed Money Supply and Aggregate Credit Not Fueling US Inflation
Interest-Rates / Money Supply Jun 28, 2008 - 05:00 PM GMTBy: Paul_L_Kasriel

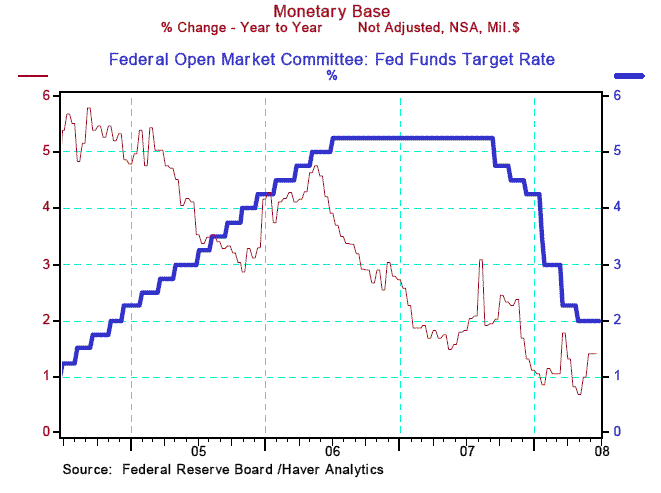
 One of the tenets of that now allegedly defunct economic schools, monetarism, is that you cannot judge the stance of monetary policy by the level of the policy interest rate. Sometimes a 2% fed funds rate might be accommodative; sometimes restrictive. Right now, the 2% fed funds rate is not the catalyst for excessive growth in the money and credit aggregates. Let's start with the credit directly created out of thin air (similar to counterfeit money) by the Federal Reserve - the monetary base.
The monetary base is the sum of bank reserves and currency. Chart 1 shows that year-over-year growth in the monetary base as of June 18 was an anemic 1.4%. Since the Fed started slashing the federal funds rate last September and creating all of these new credit facilities, growth in the monetary base has trended lower , not higher. So, the Fed, directly, is not currently fueling the inflationary fires.
Chart 1
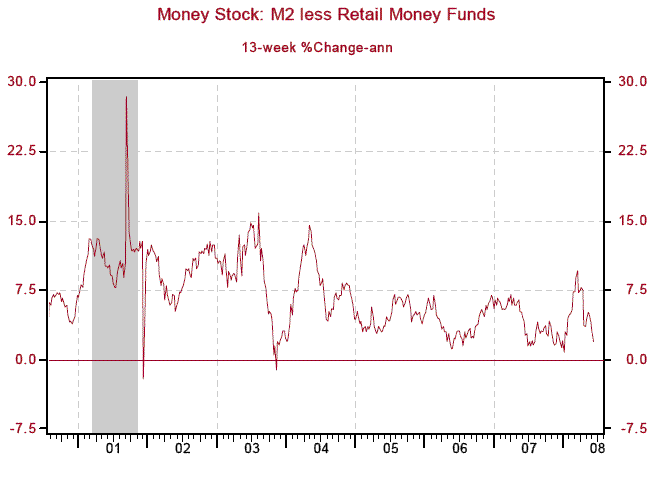
What about the banking system? As Chart 2 shows, in the 13 weeks ended June 11, the annualized rate of growth in commercial bank credit - loans and investments on the books of commercial banks - has contracted at an annualized rate of 5.4%. The other side of banks and thrifts balance sheet - their deposits - along with currency held by the nonbank public is not exactly exhibiting hyperinflationary growth. Chart 3 shows that the M2 money supply minus retail money funds has slowed to an annualized growth rate of only 1.9% in the 13 weeks ended June 16. So, don't judge a book by its cover or a central bank's policy stance by the level of its policy rate.
Chart 2
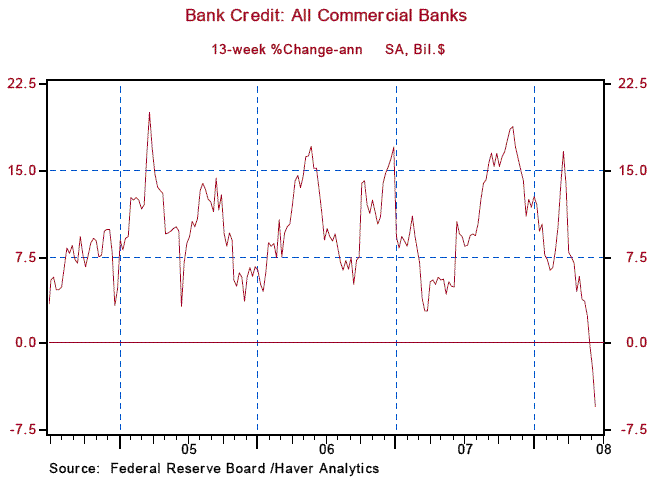
Chart 3
2008 Fiscal Stimulus - One Trick Pony?
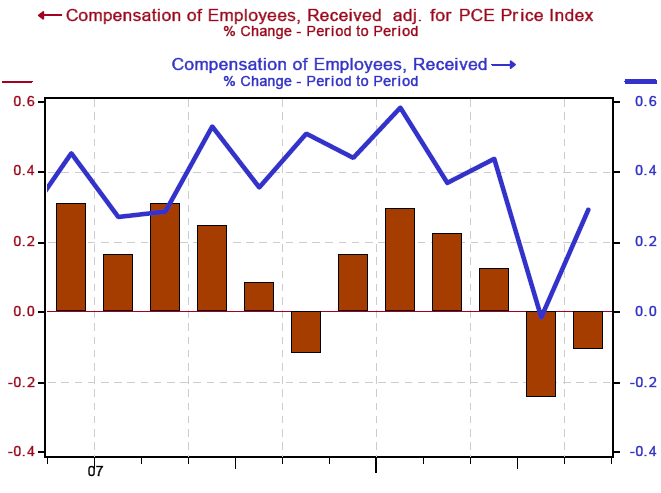
No question about it - if the U.S. Treasury cuts you a check, your income will go up and you will spend more. This is what happened in May. Personal income soared - up 1.9% month-to-month. The rate of increase in disposable personal income - personal income less taxes - was even more impressive, jumping 5.7% (see Chart 4). Of course, the 2008 fiscal stimulus program both temporarily depressed federal personal tax payments and temporarily boosted federal transfer payments (see Chart 5). If you look at total compensation of employees, you will notice that the May increase in nominal terms was much less spectacular -- up 0.3% -- and adjusted for consumer prices, it contracted for the second month in a row (see Chart 6).
Chart 4
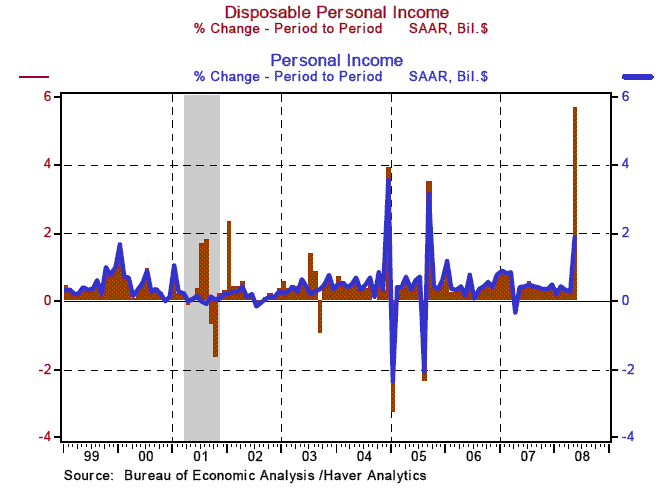
Chart 5
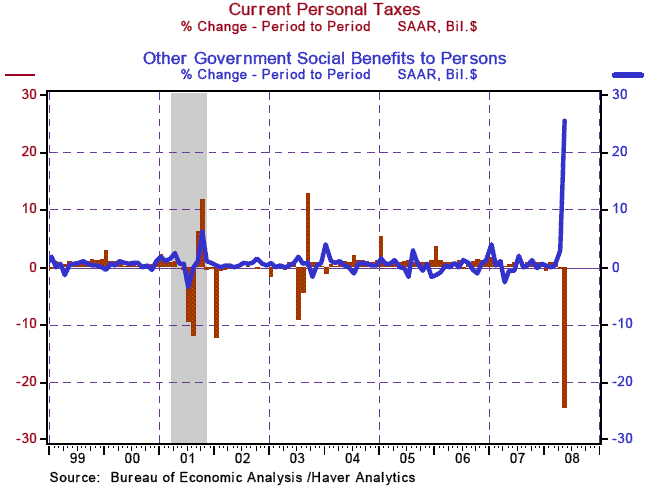
Chart 6
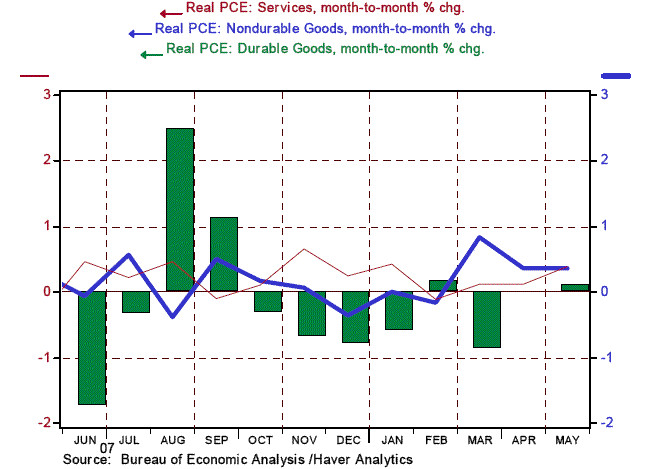
The fiscal stimulus program, no doubt, stimulated consumer spending. Adjusted for prices, personal consumption expenditures (PCE) jumped 0.4% -- their fastest monthly increase since August 2007. As Chart 7 shows, services and durable goods registered larger percentage increases in May relative to April, whereas nondurable goods posted the same percentage increase in May as in April. Perusing some of the detail, households seemed to want to escape from reality in May by stepping up their purchases of alcoholic beverages to consume in the privacy of their own (or bank-owned) homes (+1.29%), by going to the movies (+24.9%), by investing their tax rebates at blackjack tables (+2.3%) or simply boarding an airplane to get out of town (+2.7%). Come the third quarter, when the fiscal stimulus has dissipated, so will personal income and consumer spending increases.
Chart 7
By Paul L. Kasriel
The Northern Trust Company
Economic Research Department - Daily Global Commentary
Copyright © 2007 Paul Kasriel
Paul joined the economic research unit of The Northern Trust Company in 1986 as Vice President and Economist, being named Senior Vice President and Director of Economic Research in 2000. His economic and interest rate forecasts are used both internally and by clients. The accuracy of the Economic Research Department's forecasts has consistently been highly-ranked in the Blue Chip survey of about 50 forecasters over the years. To that point, Paul received the prestigious 2006 Lawrence R. Klein Award for having the most accurate economic forecast among the Blue Chip survey participants for the years 2002 through 2005.
The opinions expressed herein are those of the author and do not necessarily represent the views of The Northern Trust Company. The Northern Trust Company does not warrant the accuracy or completeness of information contained herein, such information is subject to change and is not intended to influence your investment decisions.
Paul L. Kasriel Archive |
© 2005-2022 http://www.MarketOracle.co.uk - The Market Oracle is a FREE Daily Financial Markets Analysis & Forecasting online publication.


