


Gold And Silver - Month-End Technical Review
Commodities / Gold and Silver 2015 Oct 31, 2015 - 06:15 PM GMTBy: Michael_Noonan

 A proverbial picture [chart], being worth 1,000 words, we will let the charts speak for themselves, with observations/comments attached to each one.
From our perspective, the charts are saying, irrespective of what anyone is reading or following regarding gold and silver, there appears to be no change in trend for the near term. The state of China's economy; possible confrontation between China and the US now sending ships to irritate/challenge China's control over it part of the ocean where she is building new bases; flagging response to the Fed's ongoing failure of injecting more and more fiat in an already over bloated fiat economy, in fact, world-wide; Russia's ongoing embarrassment of Washington with Russia's pinpoint air force accuracy bombing ISIS terrorists, and commensurate challenge of taking control of the Mid East from the flailing Sunni Arab coalition, Western political disarray, etc, etc, etc.
Then there is the never-ending slew of new directly related information as to facts and fundamentals about gold and silver and the ever-missing market interpretations arising from all available information.
As we always maintain, charts are the cumulative distillation of all news and also the input from all buyers and sellers that can impact the market that would otherwise be impossible to assemble and then assimilate in order to make sense of it all. The charts' developing market activity accomplishes that. It then becomes a function of how well the charts can be understood in the message[s] being conveyed for all to see.
The most obvious competition for Precious Metals [PMs], is fiat currency, and no country has been more manipulative in internationally suppressing the price of gold than the US Federal Reserve, aided and abetted by the corporate federal government. It is a perfect cover for the international elite bankers/globalists pulling the strings behind government, while at the same time, having the masses believe it is the government actually in control.
It is impossible to keep issuing endless amounts of fiat without eventually destroying the economy, and this has been on an international scale via the IMF, BIS, and central banks. It is a testament to the insidious strength of the globalists to subvert and distort the world economy and still maintain control over those being ruled.
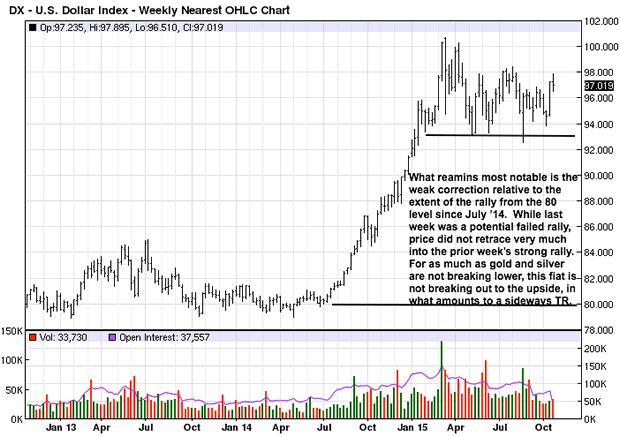
The US-issued fiat Federal Reserve Notes, widely accepted as "dollars," has maintained its relative strength, as noted by what appears to be a weak reaction, [see chart],given the degree of the rally from the 80 area. What we know about weak reactions [pullbacks in a rally], is that they almost always lead to higher prices.
The premise behind that observation is simple. If sellers have spent as much effort as they can to get price lower, and all they can accomplish is a mild correction, it is an indication that the market is in stronger hands preventing price from going lower. Once the sellers have expended themselves, new buyers, recognizing that price has held well, will rush in and add to the demand to push price higher.
The sideways TR since the March '15 high has the earmarks of a weak reaction, holding the 93 area on each attempt to breach that level and take price lower. The failed August probe lower has held twice in retest attempts, the latest 3 weeks ago. Some might interpret last week's failed retest of 98 and lower close as negative. While the range is smaller, indicating a lack of buyer ability to maintain the rally, but equally compelling is the fact that the sell off did not make much progress moving price lower. TRs [Trading Ranges], can be difficult to trade because price if failing to go to newer highs or newer lows. Best to let the TR play itself out and "go with" the confirmed directional breakout.
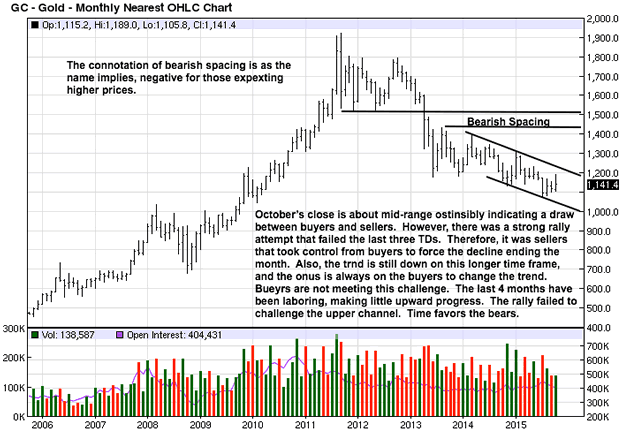
Twelve times a year, we get to present the monthly charts in order to keep a higher time frame perspective. Higher time frames are much harder to turn and change trend, so it pays to always be aware of what a monthly chart is indicating. A fact that all can agree on is that price is at recent lows when compared to the 2011 highs. That indicates the trend is down. It would be impossible to argue otherwise, whether one is an experienced chart reader or has no experience.
The comments on the chart further amplify the logic of understanding what the message of this particular chart is conveying. There is no identifiable piece of evidence that indicates any sign for change, and no change can occur before one sees such sign[s]. That may sound simplistic, but it is also true.
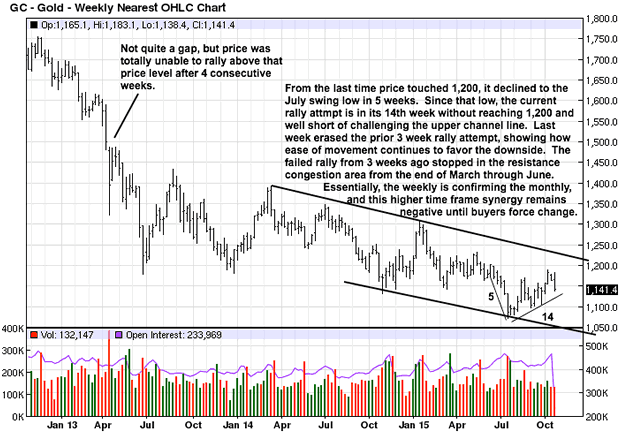
Before we see a possible change on the monthly chart, a change on the next lower time frame weekly chart will show up first. What we like to see in reading charts is a form of synergy where the respective lower time frames are in sync. We see that on the weekly: the trend is down. A similar channel shows a downward direction, and even within the channel, as is noted, price labors on rallies and has greater EDM [Ease of Downward Movement], indicating sellers are still in overall control. From 1,200, it took price 5 weeks to reach the last swing low. Since, the current reaction rally is in its 14th week and has yet to fully retrace to 1,200.
The current rally not only has failed to retrace all the loss from 1,200, over the last 14 weeks, the rally also failed to get much past a halfway retracement within the channel. Buyers need to demonstrate an ability to effect change, and any change on the weekly will first show up on the next lower time frame, the daily chart. You may be able to sense how the charts "talk" to anyone wanting to observe their message.
Charts are organically evolving in the sense that they reflect the efforts of living buyers and sellers, and computerized input still results from live direction in their origin. Charts change constantly, especially on the lower time frames. Being able to "read" the developing "story" is the best edge one can have.
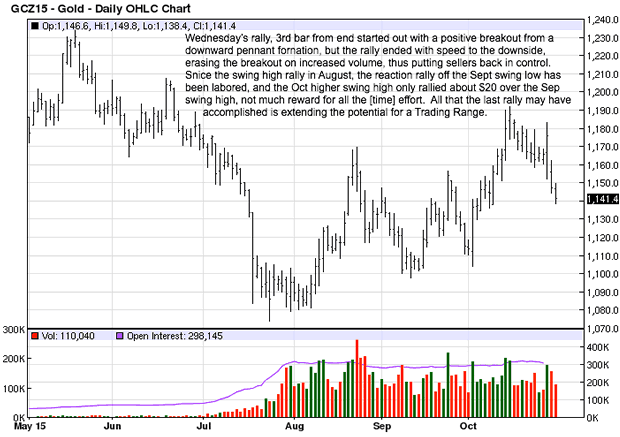
While still nearer the lows, we can see the potential for change developing on a small-scale, since the July swing low. There is a small high followed by a higher low, and then another higher high, last week. If the next reaction lower holds above the last swing low, forming another higher low, the short-term trend will change to at least sideways.
The next question is, does the daily confirm the weekly, which we noted already confirms he monthly, thus adding to the synergy of time frames? When charts are complimentary over time frames, it makes taking positions within the obvious momentum potentially more profitable.
It is easier to see the high in August followed by a higher low and then the higher October swing high, which is now being corrected. To the extent one can say gold has been trying to change trend to go higher, the angle of the rally is somewhat lax, bars are overlapping, gains harder to sustain themselves, yet price is marginally working higher.
All we can do is watch the character of this current reaction already underway and watch how much lower it goes, noting the size of the bar ranges and accompanying volume. For now, there is little to be excited about in terms of a change in trend for gold, even silver.
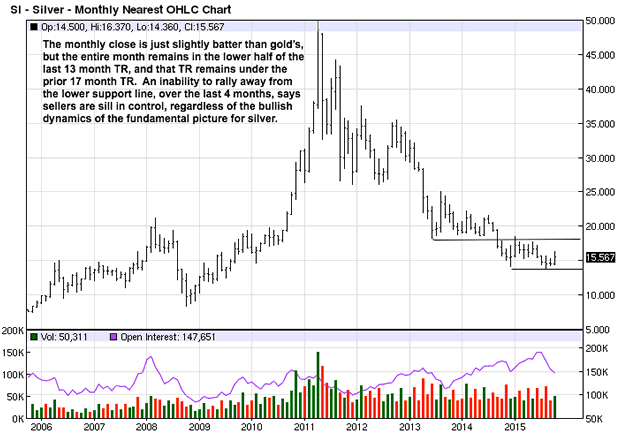
The set up for silver is slightly different from gold. The further price declines, the less is the net downward progress, but price is still going lower, so do not try to anticipate a change where none has yet occurred. The inability of price to rally up and away from the support area remains problematic.
What can be said about monthly silver is that price, for October, has a higher high, higher low, and higher close. That observation follows three months of a clustering of closes. This could be subtle sigh of possible change, but it would still need to be confirmed by stronger overall performance to the upside.
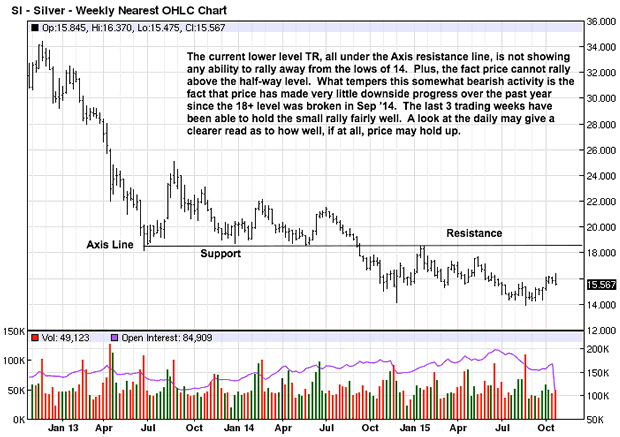
What has to be respected the most in reading the weekly chart is the fact that the current rally from the August swing low has not been able to rally above and hold, a halfway retracement in the current TR.
NMW [Needs More Work]
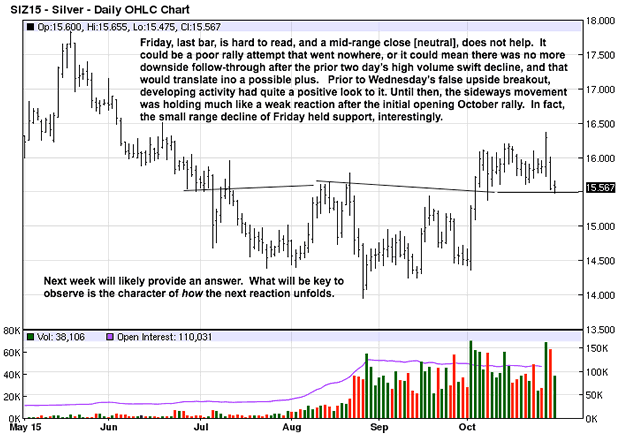
We saw the developing "story" in silver as being more positive in some time, up until last Wednesday's failed breakout rally. Like the fiat "dollar," discussed in the first chart, the rally from the early October low was holding its gains from the past few weeks. The reaction was weak, and weak reactions lead to higher prices, which is how we were viewing developing activity in silver.
The breakout rally on Wednesday did not hold. It was not confirmed, a term we often employ in judging market activity. It made sense to buy the breakout, which occurred on strong volume, but nothing is guaranteed, and a small loss resulted, the cost of doing business.
So far, the correction has not extended lower when sellers had every opportunity to press the trapped new buyers but failed to do so. Now, we simply have to watch how the market activity unfolds next week, for how it unfolds will be the message from the market as to what to expect moving forward.
If it is not clear, then there is nothing to do. Go with the flow.
By Michael Noonan
Michael Noonan, mn@edgetraderplus.com, is a Chicago-based trader with over 30 years in the business. His sole approach to analysis is derived from developing market pattern behavior, found in the form of Price, Volume, and Time, and it is generated from the best source possible, the market itself.
© 2015 Copyright Michael Noonan - All Rights Reserved Disclaimer: The above is a matter of opinion provided for general information purposes only and is not intended as investment advice. Information and analysis above are derived from sources and utilising methods believed to be reliable, but we cannot accept responsibility for any losses you may incur as a result of this analysis. Individuals should consult with their personal financial advisors.
Michael Noonan Archive |
© 2005-2022 http://www.MarketOracle.co.uk - The Market Oracle is a FREE Daily Financial Markets Analysis & Forecasting online publication.