


Crude Oil Extends Losses
Commodities / Crude Oil Dec 15, 2015 - 10:15 AM GMTBy: Nadia_Simmons

 Trading position (short-term; our opinion): No positions are justified from the risk/reward perspective.
On Friday, crude oil lost 3.34% as a bearish report from the International Energy Agency added to worries over a supply glut and affected negatively investors' sentiment. In this environment, light crude dropped to a fresh 2015 low, slipping to the lowest level since Feb 2009. What's next?
On Friday, in its December oil market report, the International Energy Agency projected that global energy markets will remain oversupplied in (at least) the near future. Although the IEA expects that non-OPEC production would decrease by 600,000 bpd in 2016 (as U.S. shale producers will continue to leave the market due to declining oil prices), the agency lowered its global demand projection to 1.2 million barrels per day from its 2015 expectations for growth of 1.8 million bpd. Thanks to this disappointing report and news that OPEC pumped 31.695 million barrels of crude per day in November (230,100 barrels more than a month earlier), the price of the commodity declined sharply and dropped to the lowest level since Feb 2009. What's next? Let's examine charts and find out what can we infer from them (charts courtesy of http://stockcharts.com ).
Quoting our Oil Trading Alert posted on Dec 8:
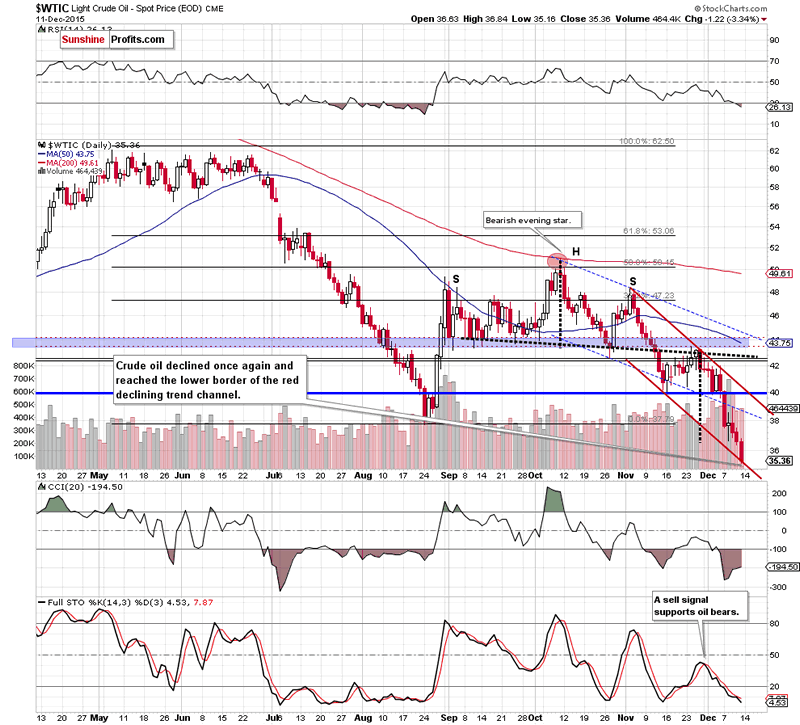
(...) a sharp decline (...) took light crude below the Aug low. This is a bearish signal, which suggests that our next downside target (around $36.50, where the size of the downward move will correspond to the height of the head and shoulders formation) would be in play in the coming day(s).
Looking at the daily chart, we see that oil bears not only took the commodity to the above-mentioned downside target, but also managed to push the price below it and crude oil declined to our next target - the lower border of the red declining trend channel.
How did this move affect the medium-term picture? Let's examine the weekly chart and find out.
On Friday, Dec 4, we wrote:
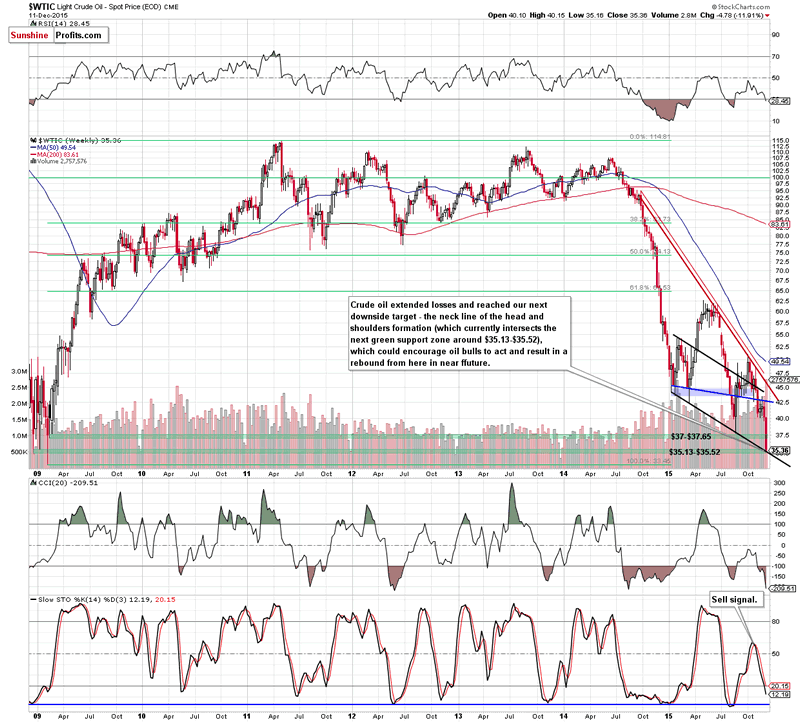
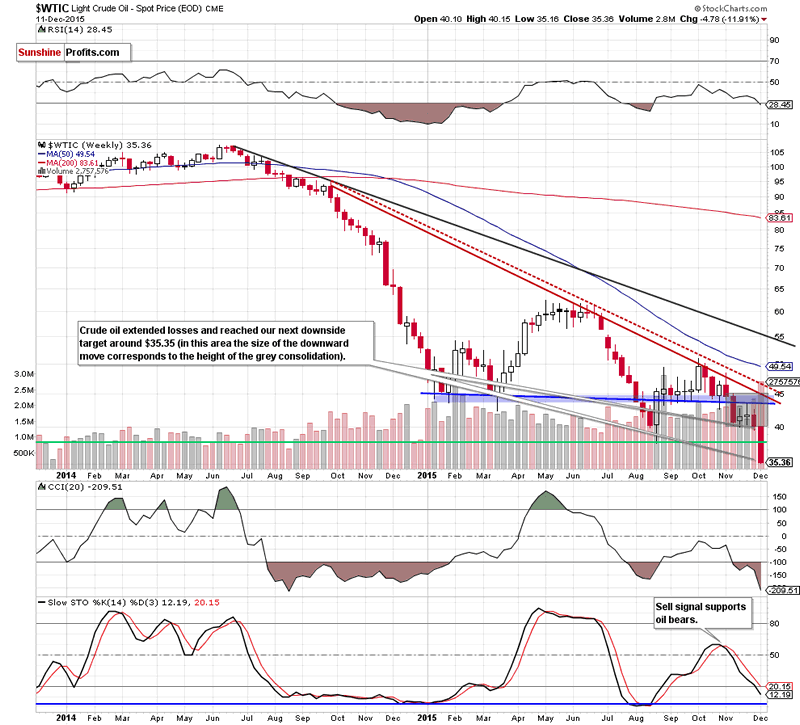
(...) crude oil remains in a consolidation (marked wih grey) under the key resistance zone. A potential breakdown under the lower line of the formation could bring not only a test of the Aug low, but also a fresh 2015 low around $35.35 (in this area the size of the downward move would correspond to the height of the formation).
Last Tuesday, we added:
(...) Friday's breakdown under the lower border of the consolidation triggered a sharp decline, which approached the commodity to the upper green support zone marked on the above chart. If it is broken, we'll see further deterioration and a drop to the lower green zone around $35.13-$35.52. At this point, it is worth noting that in this area is also the neck line of the head and shoulders formation (marked with black), which could encourage oil bulls to act and pause the downward move.
From today's point of view, we see that the situation developed in line with the above scenario and crude oil declined sharply (in the previous week, the commodity lost almost 12%, making our short positions even more profitable) to our downside target.
As we mentioned earlier, the combination of the lower green support zone around $35.13-$35.52 and the neck line of the head and shoulders formation (marked with black) could be strong enough to pause further declines and trigger a rebound from the current levels (please note that this area is also reinforced by the lower border of the red declining trend channel marked on the daily chart). If we see such price action, the initial upside target would be around $37.75-$38.52, where the Aug lows are. If this resistance area is broken, we may see an upward move even to the barrier of $40.
Summing up, crude oil extended losses and reached our downside target in the solid support zone, which could encourage oil bulls to act and trigger a rebound in the coming days. Taking this fact into account, we believe that taking sizable profits off the table (as a reminder, we opened short positions when crude oil was trading around $46.69) is the best investment decision at the moment. In our opinion, the medium-term trend remains down and lower values of the commodity are still ahead us. Therefore, we'll likely re-open short positions at higher prices (after crude oil will finish its corrective upswing) in near future.
Very short-term outlook: mixed
Short-term outlook: mixed with bearish bias
MT outlook: bearish
LT outlook: mixed with bearish bias
Trading position (short-term; our opinion): No positions are justified from the risk/reward perspective.
Thank you.
Nadia Simmons
Forex & Oil Trading Strategist
Przemyslaw Radomski
Founder, Editor-in-chief
Sunshine Profits: Gold & Silver, Forex, Bitcoin, Crude Oil & Stocks
Stay updated: sign up for our free mailing list today
* * * * *
Disclaimer
All essays, research and information found above represent analyses and opinions of Nadia Simmons and Sunshine Profits' associates only. As such, it may prove wrong and be a subject to change without notice. Opinions and analyses were based on data available to authors of respective essays at the time of writing. Although the information provided above is based on careful research and sources that are believed to be accurate, Nadia Simmons and his associates do not guarantee the accuracy or thoroughness of the data or information reported. The opinions published above are neither an offer nor a recommendation to purchase or sell any securities. Nadia Simmons is not a Registered Securities Advisor. By reading Nadia Simmons’ reports you fully agree that he will not be held responsible or liable for any decisions you make regarding any information provided in these reports. Investing, trading and speculation in any financial markets may involve high risk of loss. Nadia Simmons, Sunshine Profits' employees and affiliates as well as members of their families may have a short or long position in any securities, including those mentioned in any of the reports or essays, and may make additional purchases and/or sales of those securities without notice.
Nadia Simmons Archive |
© 2005-2022 http://www.MarketOracle.co.uk - The Market Oracle is a FREE Daily Financial Markets Analysis & Forecasting online publication.