


Whither Silver Price?
Commodities / Gold and Silver 2015 Dec 15, 2015 - 10:30 AM GMTBy: Dan_Norcini

 In a bit of a surprise today, crude oil somehow managed to pop high after falling below $35 at one point. It seems like it was more a case of running out of sellers rather than aggressive new buying.
Part of the reason for the move higher was that same pestilential macro trade that seemingly surfaces every single time the Dollar moves lower, namely the macro boyz start buying commodities in general.
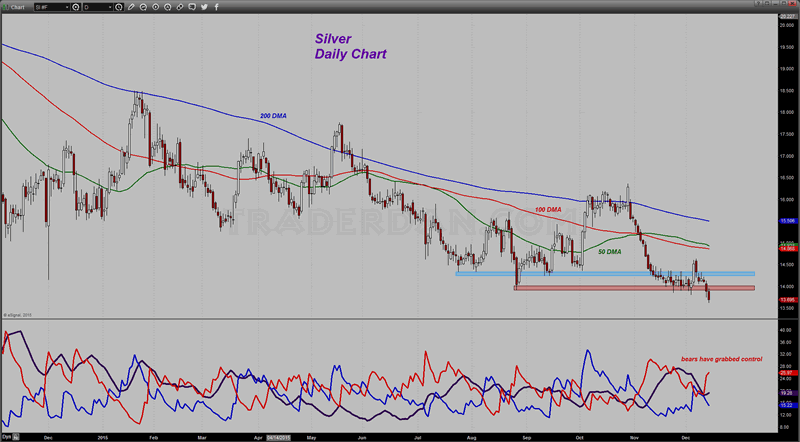
Even that however, did not allow pressure to abate all that significantly across the broader commodity complex. While the grains were higher on account of Dollar weakness, the meats could not get out of the way of falling cattle prices with the hogs dragged lower as a result. There was also weakness in the softs today as well as weakness in copper, gold and especially in silver, which managed to take out another downside support level as it set a fresh 6 year low.
Daily Silver Chart
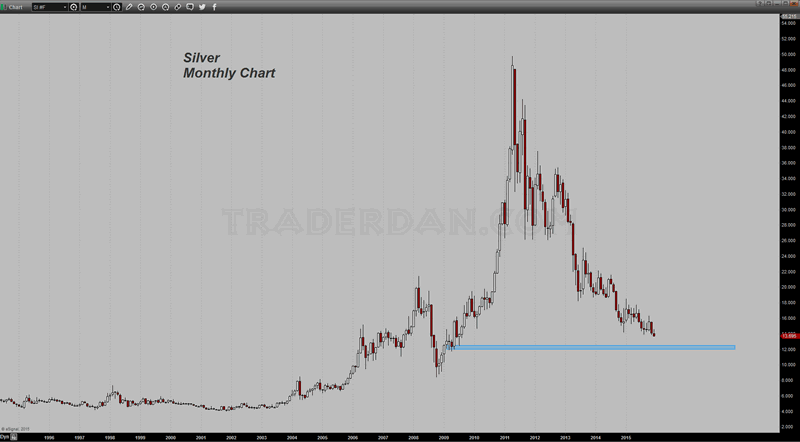
At this point I have no idea how low silver prices might yet fall, but in looking at the monthly chart, there does not seem to be a whole lot of downside support in the market until one gets closer to the $12.65 level. It has already retraced every single one of the major Fibonacci levels from the 2008 low to the 2011 peak meaning that by definition, it should move to erase the entirety of the upmove off of that 2008 low. That is near $8.40. Could it get that low? Who knows? But one thing is certain, namely this is one ugly chart.
Monthly Silver Chart
Here's the problem with Silver... these hedge funds are still holding a significant number of long positions in the market.
Hedge Funds Outright Long Positions as % of Total Open Interest
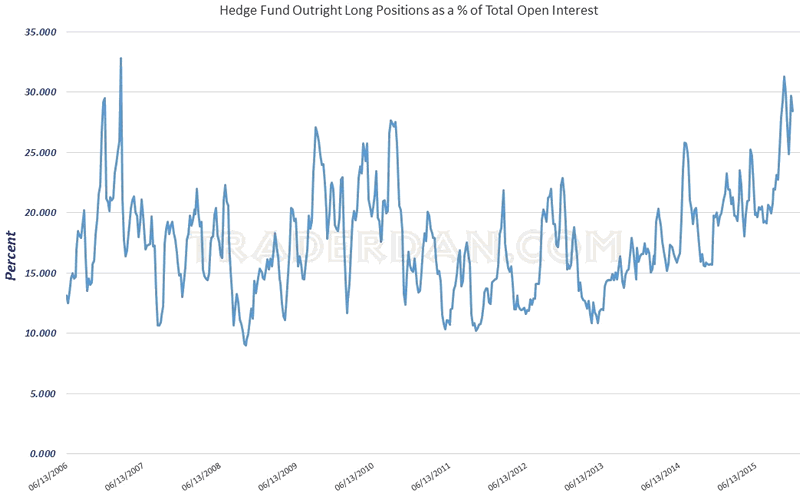
For some odd reason, in much the same manner as the oddity of the hedge funds remaining on the long side of the crude oil market as it has collapsed, the hedgies remain married to the long side of silver. In and of itself, that is not necessarily a problem. The problem arises when DOWNSIDE CHART SUPPORT levels are being taken out, as is the case now. Those hedge funds are now going to be forced out.
Silver CoT
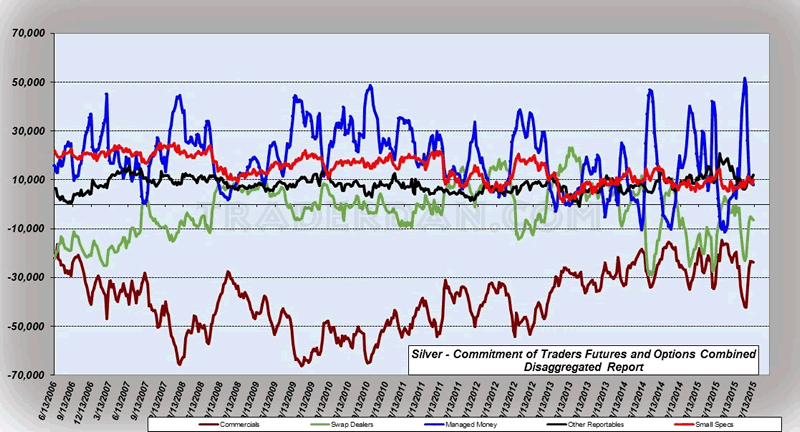
Hedge Funds Outright Positions in Silver
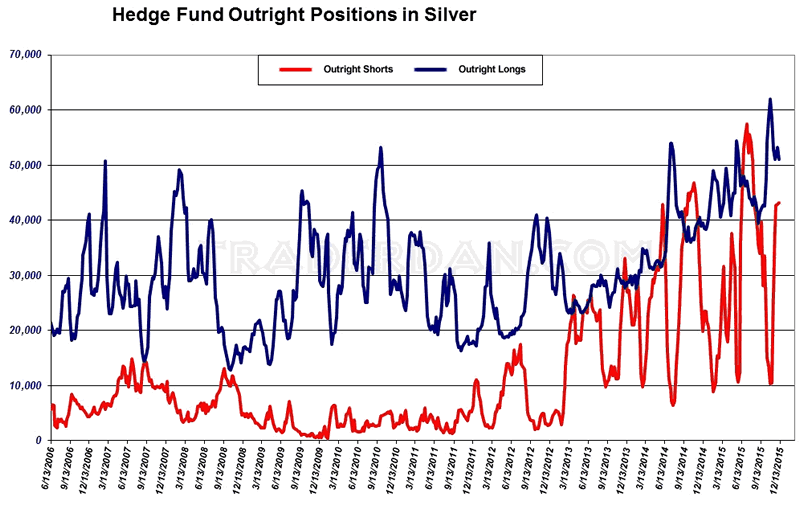
As you can see, hedgies have been increasing their short side exposure to silver, which is what one would expect them to be doing given the horrible technical chart pattern the metal is displaying but look at how SLOWLY they are reducing the number of their outright longs. The simple truth is the dark blue line on the second chart is ABOVE the red line meaning that there are more long positions in silver being held by hedge funds than there are short positions.
The further this thing goes south, and more importantly, the more downside technical support levels are violated, the more selling fuel there is in this market as that heavy long position goes deeper and deeper and deeper under water.
I realize that the hedgies have deep pockets but being long silver is draining those pockets very quickly!
One last chart...
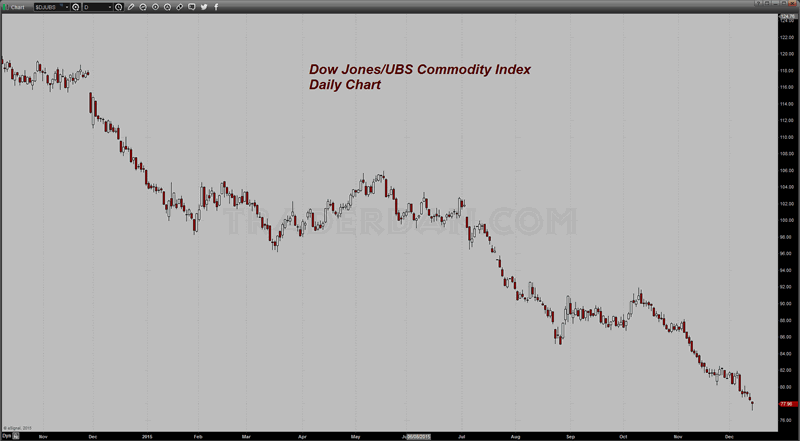
Dow Jones/UBS Commodity Index Daily Chart
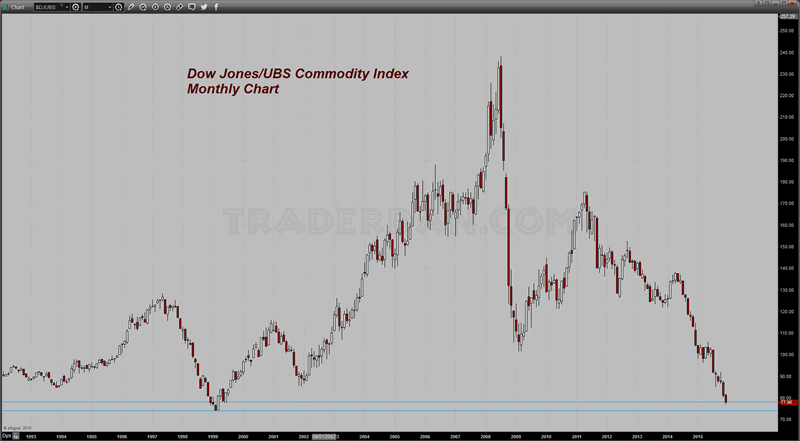
Look at the LONG TERM CHART:
Dow Jones/UBS Commodity Index Monthly Chart
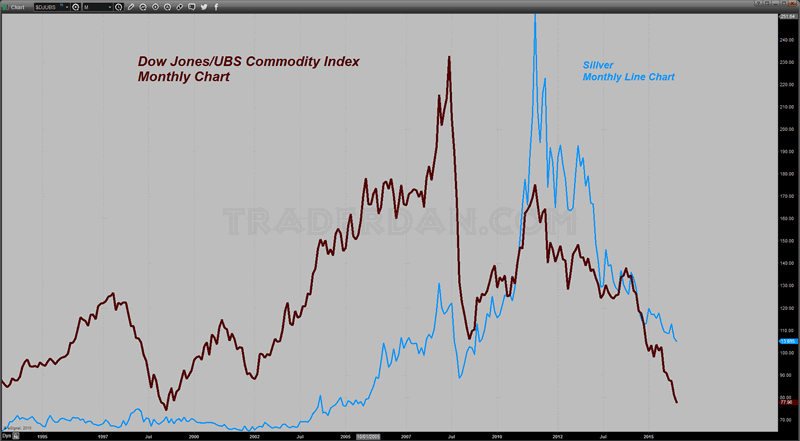
Lastly, a long term view of both the Commodity Index and the Silver price. Given the chart of the Commodity index, why would anyone in their right mind be bullish silver when they are fighting a trend lower? That is why I cannot understand how the hedge funds have so screwed up this particular trade. Amazing...
Dow Jones/UBS Commodity Index and Silver Monthly Chart
Dan Norcini is a professional off-the-floor commodities trader bringing more than 25 years experience in the markets to provide a trader's insight and commentary on the day's price action. His editorial contributions and supporting technical analysis charts cover a broad range of tradable entities including the precious metals and foreign exchange markets as well as the broader commodity world including the grain and livestock markets. He is a frequent contributor to both Reuters and Dow Jones as a market analyst for the livestock sector and can be on occasion be found as a source in the Wall Street Journal's commodities section. Trader Dan has also been a regular contributor in the past at Jim Sinclair's JS Mineset and King News World as well as may other Precious Metals oriented websites.
Copyright © 2015 Dan Norcini - All Rights Reserved
All ideas, opinions, and/or forecasts, expressed or implied herein, are for informational purposes only and should not be construed as a recommendation to invest, trade, and/or speculate in the markets. Any investments, trades, and/or speculations made in light of the ideas, opinions, and/or forecasts, expressed or implied herein, are committed at your own risk, financial or otherwise. The information on this site has been prepared without regard to any particular investor’s investment objectives, financial situation, and needs. Accordingly, investors should not act on any information on this site without obtaining specific advice from their financial advisor. Past performance is no guarantee of future results.
Dan Norcini Archive |
© 2005-2022 http://www.MarketOracle.co.uk - The Market Oracle is a FREE Daily Financial Markets Analysis & Forecasting online publication.