


Stocks Bull/Bear Market Inflection Point Approaching
Stock-Markets / Stock Markets 2016 Jan 09, 2016 - 05:59 PM GMTBy: Tony_Caldaro

 Volatile week ends with a steep selloff. The week started at SPX 2044. Monday’s gap down took it to SPX 1990, before rallying with a gap up on Tuesday to 2022. Gap down openings on Wednesday/Thursday took the SPX to 1939. Then after a gap up opening on Friday to SPX 1960, then market dropped to end the week at 1922. For the week the SPX/DOW lost 6.10%, the NDX/NAZ lost 7.15%, and the DJ World index lost 6.10%. Economic reports for the week were mostly negative. On the uptick: the ADP and Payrolls, plus the trade deficit and weekly jobless claims improved. On the downtick: ISM manufacturing/services, construction spending, factory orders, wholesale inventories, consumer credit, the WLEI and GDPn. Next week we get reports on Industrial production, the FED’s Beige book and Export/Import prices.
LONG TERM: bull market under pressure
The bull market from 2009 ran into turbulence again this week, for the second time since the actual print high at SPX 2135 back in May 2015. We have been labeling this long term advance as a five Primary wave, Cycle wave [1], bull market. Primary waves I and II completed in 2011, and Primary waves III and IV completed in 2015. Primary wave V began at the August 2015 SPX 1867 low.
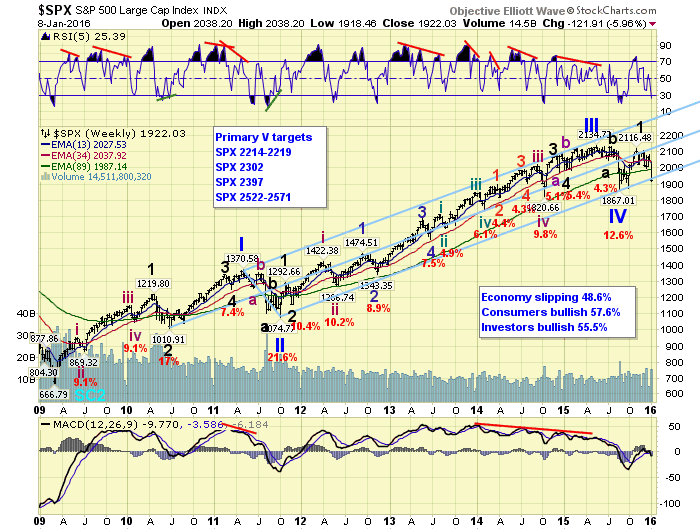
The uptrend that followed that Primary IV low was quite choppy, but did manage to hit an orthodox high of SPX 2116 just 1% below the bull market high. Since that high in early November the market has corrected 9.4%. Of the 20 corrections during this bull market this percentage falls about in the middle of the range. However, since the August-November uptrend rallied 249 points, and the correction, since then, has already declined 198 points, it is getting close to a full retracement. A full retracement at this stage of the bull market, in OEW terms, would probably suggest Primary V ended with a fifth wave failure at SPX 2116/2104, and a bear market is now underway.
We noted last week the upside potential was 20+% with a downside risk of about 9%. After this week’s wave of selling the upside potential is even greater with a downside risk of 3%. Unfortunately, should the market drop another 3%, it dropped 6% this week, the bull market is probably over. As we have noted all along. The stock market usually loses, during a Cycle wave [2] bear market, 45% to 50% of its value. So the bear market could be quite severe. When/if OEW confirms a bear market we will notify everyone in the daily update.
MEDIUM TERM: downtrend
Due to the choppiness of the previous uptrend we have been labeling this downtrend from the secondary high at SPX 2104. We had counted that uptrend as five waves up with a fifth wave failure: 1993-1872-2116-2019-2104. It would be ironic if the fifth wave failure in the uptrend signaled a fifth wave failure in the bull market as well. But until a bear market is confirmed this is only speculation.
Until it is confirmed we are labeling the recent uptrend as Major wave 1 of Primary V, with the current downtrend Major wave 2. Since I do not recall ever seeing a fifth wave failure of Primary degree, it still appears to be the appropriate count. Major wave 2 is unfolding in three Intermediate waves: wave A 1993, wave B 2082 and wave C currently underway. Each of the Intermediate waves have divided into three Minor waves each.
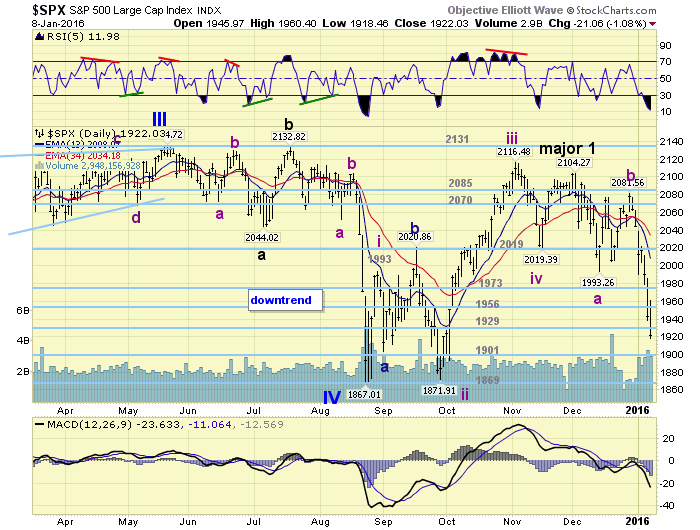
Intermediate wave C, the current decline, appears to be in Minor C of its abc: 1990-2022-1918 so far. In an attempt to uncover the next support level we find three levels right near Friday’s low and the OEW 1901 pivot. At SPX 1908 the downtrend would have retraced 0.786% of Major wave 1. A rarely used relationship, but 0.618% has already been exceeded. At SPX 1916 Intermediate C = 1.5 Int. A, and at SPX 1902 Int. C = 1.62 Int. A. These levels suggest Friday’s low, SPX 1918, could have been the low. And if not there is still good support in the 1901 pivot range. After that the next pivot is 1869, which is right at the full retracement level. So the 1901 pivot looks like it is quite important for the bull market scenario. Medium term support is at the 1901 and 1869 pivots, with resistance at the 1929 and 1956 pivots.
SHORT TERM
As noted above it still looks like the market is in Int. C, specifically Minor C, of Major wave 2. From the Int. wave B high at SPX 2082, Minor wave A was a simple three wave decline: 2046-2063-1990. Then after a choppy Minor B wave rally to SPX 2022, the market entered a very choppy/subdividing Minor C. If we count the choppy decline to 1954, the best rally of the decline to 1977, then the choppy decline from that high equals the first at SPX 1909. So we have a confluence of support around Friday’s low, and the OEW 1901 pivot range.
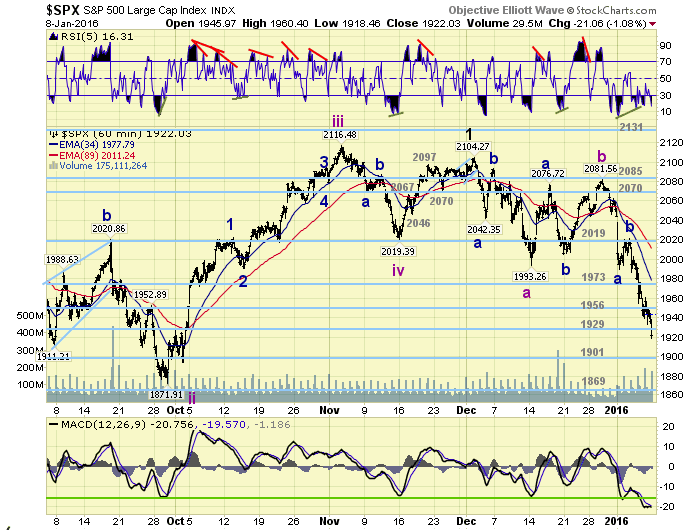
Short term support is at SPX 1916 and the 1901 pivot, with resistance at the 1929 and 1956 pivots. Short term momentum ended the week with an ongoing positive divergence. Best to your trading next week, it looks to be a pivotal one for this bull market.
FOREIGN MARKETS
Asian markets were all lower for a net loss of 5.2%.
European were also all lower and lost 7.0%.
The commodity equity group lost 4.1%.
The DJ World remains in a downtrend and lost 6.1%.
COMMODITIES
Bonds look to be in an uptrend and gained 1.2%.
Crude remains in a downtrend and lost 11.3%.
Gold is in an uptrend and gained 4.1%.
The USD is still in a downtrend but gained 0.2%.
NEXT WEEK
Tuesday: a speech from FED vice chair Fischer. Wednesday: the FED’s Beige book and the Treasury deficit. Thursday: weekly Jobless claims and Export/Import prices. Friday: Retail sales, the PPI, NY FED, Industrial production, Consumer sentiment, Business inventories and Options expiration.
CHARTS: http://stockcharts.com/public/1269446/tenpp
After about 40 years of investing in the markets one learns that the markets are constantly changing, not only in price, but in what drives the markets. In the 1960s, the Nifty Fifty were the leaders of the stock market. In the 1970s, stock selection using Technical Analysis was important, as the market stayed with a trading range for the entire decade. In the 1980s, the market finally broke out of it doldrums, as the DOW broke through 1100 in 1982, and launched the greatest bull market on record.
Sharing is an important aspect of a life. Over 100 people have joined our group, from all walks of life, covering twenty three countries across the globe. It's been the most fun I have ever had in the market. Sharing uncommon knowledge, with investors. In hope of aiding them in finding their financial independence.
Copyright © 2015 Tony Caldaro - All Rights Reserved Disclaimer: The above is a matter of opinion provided for general information purposes only and is not intended as investment advice. Information and analysis above are derived from sources and utilising methods believed to be reliable, but we cannot accept responsibility for any losses you may incur as a result of this analysis. Individuals should consult with their personal financial advisors.
Tony Caldaro Archive |
© 2005-2022 http://www.MarketOracle.co.uk - The Market Oracle is a FREE Daily Financial Markets Analysis & Forecasting online publication.