


The Dot Plot, Treasuries and the Gold Stocks TSX.V
Commodities / Gold and Silver Stocks 2016 Jan 10, 2016 - 03:46 PM GMTBy: Richard_Mills

 The Federal Reserve has finally raised their target for the Fed Funds rate. In a unanimous vote members decided to raise rates by 25 basis points to 0.25 - 0.50 per cent. It was the first hike since June 2006 when then Fed head Ben ‘helicopter’ Bernanke increased the benchmark rate from 5 to 5.25 percent.
How far and how fast will the Fed's rate-hike cycle go? Maybe Federal Reserve members themselves can tell us that…
Dot plot
Each member of the Federal Open Market Committee (the FOMC is the branch of the United States Federal Reserve that determines the course of monetary policy), have anonymously provided their predictions for the future target fed funds rate. The Fed releases those predictions in a chart with each member getting one dot at their target interest rate level for each time period.
The bank's "dot plot," suggests as many as four rate hikes in 2016 and a Fed funds rate of 3.5 to 4.0 percent longer term.
Why am I looking at increasing yields? Read on…
Here’s a chart of the old VSE and the now TSX.Venture.
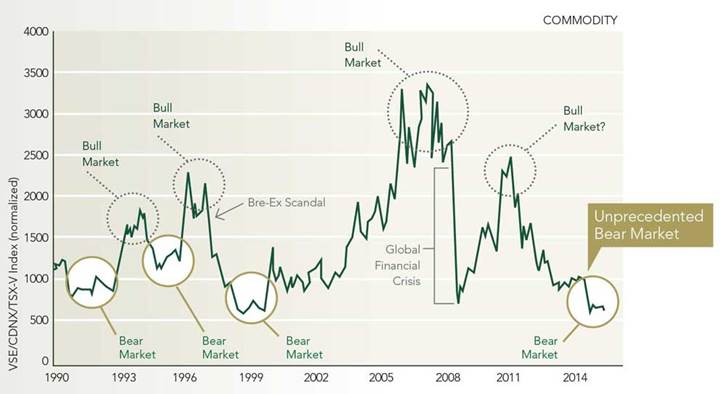
chart two Business Insider
I like chart two for a couple reasons:
1. It shows a bear market, the inevitable rise being a bull market, the top of the bull market, the bear market or the slide down, the bear bottom, the rise or bull market.
2. Shows the VSE/TSX.V has not dropped below 500.
Below is a current one year chart of the TSX.V, is the bottom in, maybe close to in?
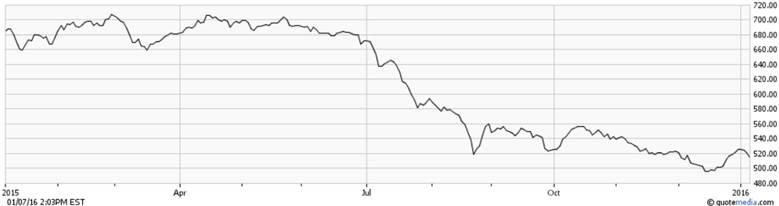
chart three
With the majority of companies listed on the TSX Venture being involved in the resource sector – commodities – it might seem logical to believe, and you certainly couldn’t be faulted for it, that the TSX.V is a commodities price driven exchange. When commodities are doing well, the exchange does well and of course vice versa.
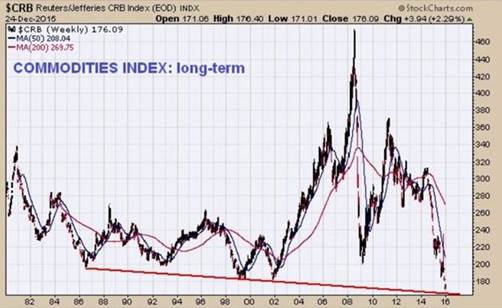
chart four
The TSX.V (chart three) is close to historic lows, commodity prices (chart four) have literally fallen off a cliff. A logical assumption would be that the TSX.V is a commodities price driven exchange - but you’d be wrong.
TSX.V bull and bear markets are driven by the Feds overnight rate increases/decreases and the direction of U.S. Treasury bond yield increases or decreases.
Look at 1999 or 2009 for the start of two bull markets, (compare charts 5&6 to chart seven). Treasury bond yields started to climb, commodities started to climb, the TSX.V started to move up. The exact opposite happened in 2002 and 2011.
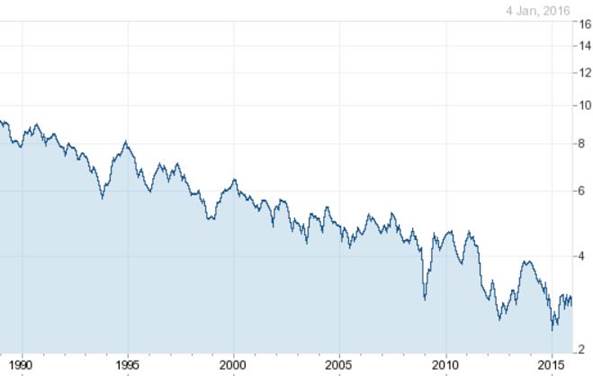
chart five 30 year yield
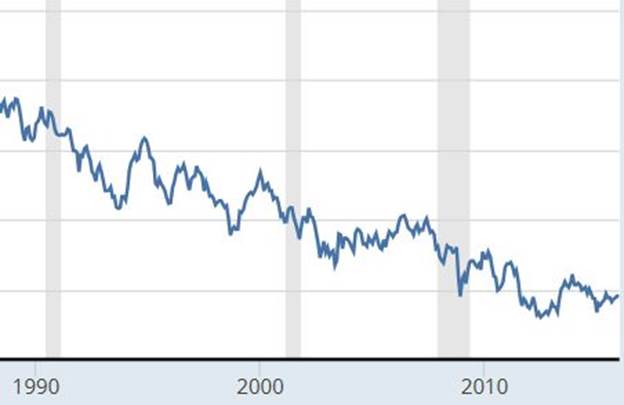
chart six 10 year yield
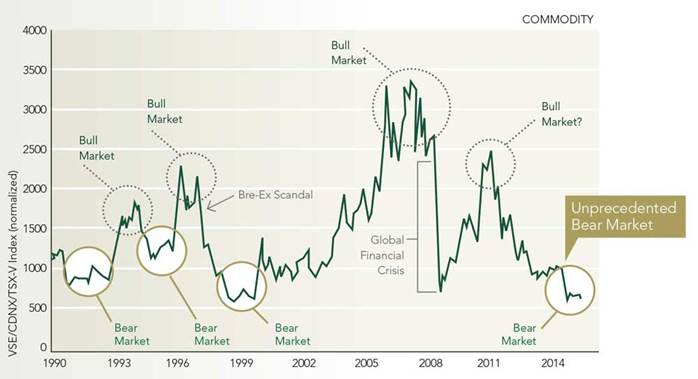
chart seven
Below is a Commodity Metals Price Index Monthly Price from indexmundi.com. Included are Copper, Aluminum, Iron Ore, Tin, Nickel, Zinc, Lead, and Uranium Price Indices.
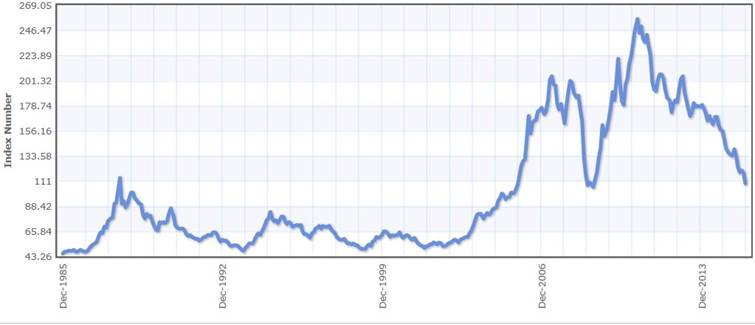
Chart eight
Fact; The TSX.V almost always moves in the same direction as Treasury bond yields.
Fact; Treasury yields go up if the Federal Reserve increases its target for the federal funds rate.
Fact; Treasury bond yields can go up even if investors merely expect the fed funds rate to go up.
Fact; The Fed’s funds rate is going up.
The U.S. Federal Reserve has been manipulating and holding down rates in an attempt to stimulate economic growth. Investors, in a search for yield, bid up the stock market and bought enormous amounts of junk bonds. Management backed up the truck and filled it with stock buybacks further supporting stock prices.
Since the wake of the global financial crisis the U.S. has seen its longest run of historically low interest rates - zero to 0.25%. Now rates are starting to rise and the free lunch is off the table. Stocks are going to feel the effects of this sudden no stimulus along with the pain of overseas earnings being brought home to a strong dollar.
A strong dollar helps Americans by making imports cheaper and curbing inflation. However a strong US$ hurts U.S. based multinationals who have overseas earnings in those very same currencies that have taken such a severe beating versus the soaring U.S.$. The dollar's surge is reducing earnings. Bringing those declining yen, pesos, dinars, francs etc. home isn’t doing any good for bottom lines, in fact it could be an earnings disaster in the making.
Junk bonds are issued by companies with low credit ratings and high debt levels – they are the higher yielding bonds with most often extremely ugly credit ratings. Investors fell in love with them when searching for yield after the 2008 financial crisis.
Junk bonds grabbed headlines in December 2015 when a rout sent prices tumbling the most in four years. Energy and energy related firms, which make up the largest chunk of the market, are trying to cope with persistently low oil prices. With the supply/demand imbalance still growing in the oil market investors are worried many will default in the coming years. The negative sentiment has crossed over and hit junk bonds and derivatives in other industries.
Where’s the hot money going to go when stock markets have lost all support and junk bonds have sold off?
“I think the economy is on the road to recovery. We’re doing well.” Janet L. Yellen, U.S. Federal Reserve chairwoman
Whether you agree with Janet Yellen or not the Federal Reserve’s overnight rate is going up. This will affect the rates charged on credit cards, loans, savings accounts and yields on short-term bonds as these interest rates follow the overnight rate in lockstep.
The effect, or yield rise on medium to longer-term bonds will be more muted and slower to take hold - yields usually move in the same direction as the fed funds rate, but not in lockstep. As the Federal Reserve implements more hikes down the road - the Dot Plot projects 4 rate hikes, or a hike every second meeting in 2016 - the effects on yields will accelerate.
The Fed are raising their overnight interest rates. Longer term Treasury bond yields *almost always increase during a lengthy tightening cycle by the Fed. The TSX.V moves in the same direction as Treasury bond yields.
*In 2004 to 2006, the last time the Federal Reserve raised its overnight rates, long term rates went up, then slipped for a few months. Over that same time period gold went from US$400 to US$700, a magnificent 75% climb.
Conclusion
We need to keep an eye on the Fed’s overnight interest rate moves, if the Fed is entering a prolonged rate raising cycle we can benefit. The ahead of the herd play would be buying shares in junior resource companies at the bottom of the market, or close to it, before the hot money, and the slow to catch on money, starts chasing real things - commodities, gold and silver.
I’ve got buying some carefully researched resource (precious metals, uranium, copper and nickel supply/demand fundamentals offer huge opportunities) companies listed on the TSX.V on my radar screen. Are they on your screen?
If not, maybe it should be.
By Richard (Rick) MillsIf you're interested in learning more about the junior resource and bio-med sectors please come and visit us at www.aheadoftheherd.com
Site membership is free. No credit card or personal information is asked for.
Richard is host of Aheadoftheherd.com and invests in the junior resource sector.
His articles have been published on over 400 websites, including: Wall Street Journal, Market Oracle, USAToday, National Post, Stockhouse, Lewrockwell, Pinnacledigest, Uranium Miner, Beforeitsnews, SeekingAlpha, MontrealGazette, Casey Research, 24hgold, Vancouver Sun, CBSnews, SilverBearCafe, Infomine, Huffington Post, Mineweb, 321Gold, Kitco, Gold-Eagle, The Gold/Energy Reports, Calgary Herald, Resource Investor, Mining.com, Forbes, FNArena, Uraniumseek, Financial Sense, Goldseek, Dallasnews, Vantagewire, Resourceclips and the Association of Mining Analysts.
Copyright © 2016 Richard (Rick) Mills - All Rights Reserved
Legal Notice / Disclaimer: This document is not and should not be construed as an offer to sell or the solicitation of an offer to purchase or subscribe for any investment. Richard Mills has based this document on information obtained from sources he believes to be reliable but which has not been independently verified; Richard Mills makes no guarantee, representation or warranty and accepts no responsibility or liability as to its accuracy or completeness. Expressions of opinion are those of Richard Mills only and are subject to change without notice. Richard Mills assumes no warranty, liability or guarantee for the current relevance, correctness or completeness of any information provided within this Report and will not be held liable for the consequence of reliance upon any opinion or statement contained herein or any omission. Furthermore, I, Richard Mills, assume no liability for any direct or indirect loss or damage or, in particular, for lost profit, which you may incur as a result of the use and existence of the information provided within this Report.
Richard (Rick) Mills Archive |
© 2005-2022 http://www.MarketOracle.co.uk - The Market Oracle is a FREE Daily Financial Markets Analysis & Forecasting online publication.