


Stock Market Short-Term Bottom in place: You will lose money if you Short Now
Stock-Markets / Stock Markets 2016 Jan 22, 2016 - 08:23 PM GMTBy: Chris_Vermeulen

 The whole world is in disbelief that the stock markets are not collapsing, right now. It is going to be a slow bear market decline. I had written an article called “The Power Of Seven”; many were skeptical of my suggestion warning investors for move to cash. I was right on target. Now, the markets are tanking and experts are calling for all sorts of levels, I believe I am correct again, by calling for an intermediate bottom in the markets that may last much longer than traders expect.
Many believe that catching the top and bottom, is not only difficult, but impossible. With my predictive trend analytics models, I constantly identify both bottoms and tops on varous timeframes rom intraday to monthly charts, which if you have been following me for some time very well know.
Why Am I Confident Of A Bottom Right Now?
Along with my models, which suggest a bottom, the following charts will also explain why we believe the an intermediate bottom is in place and that it is the wrong time to short the market, or sell your holdings. Its much like the August crash, if you paniced out at the bottom like 95% of traders and investors did, then you know exactly what time talking about.
RSI suggests a pullback is coming:
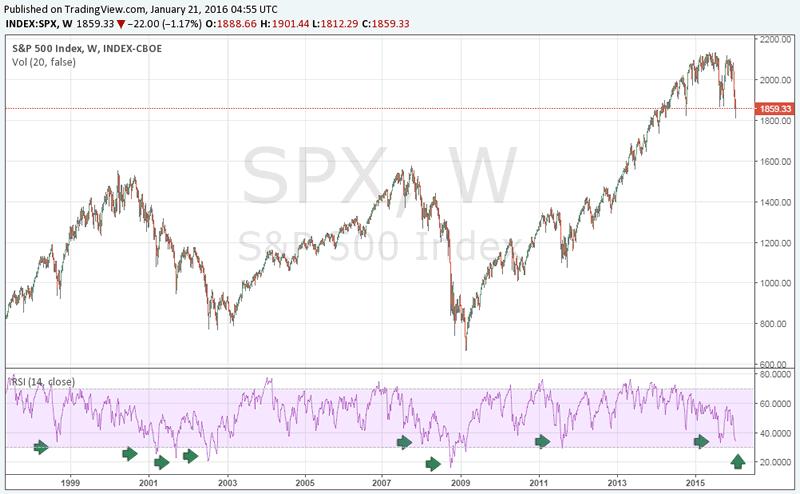
During the last 15 years, everytime the RSI on the weekly chart, came close to the oversold levels, I had seen a bounce; I do not believe this time it is going to be any different. I expect to see a strong sharp rally from the current levels, which will catch all the shorts off guard. The time to enter a short, has currently passed and it is now time to be positioned for a bear market bounce.
Respect the age old pattern ‘The Doji’
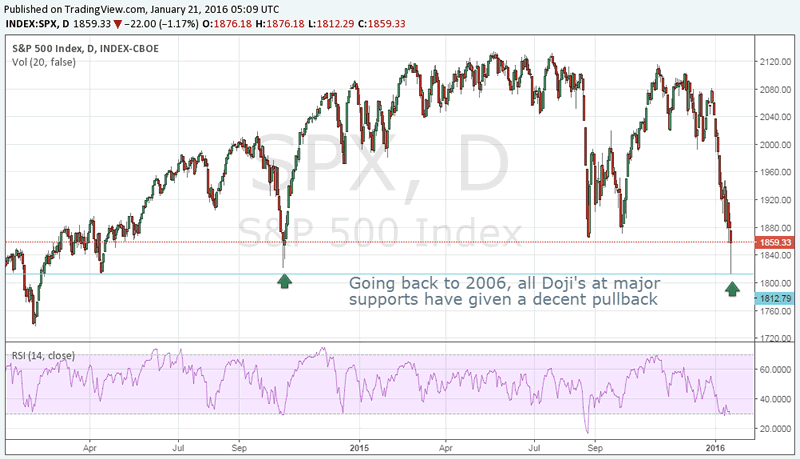
The Japanese candlestick style of trading has been in use for centuries. One of the most important and reliable patterns, is the “Doji”, which is a candlestick representing indecision. I have noted that going back to 2006, whenever the market made a doji pattern, at major support levels, it was consequently followed by a considerable bounce. The pattern displayed on January 20th, 2016, is one such pattern, which will take US Equities higher.
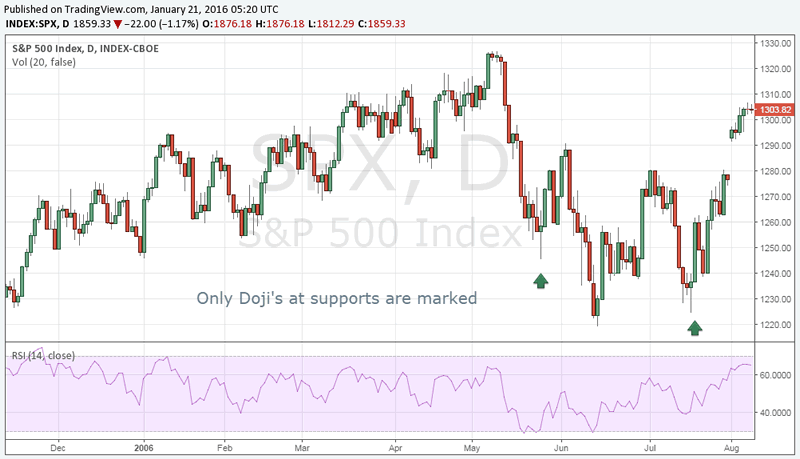
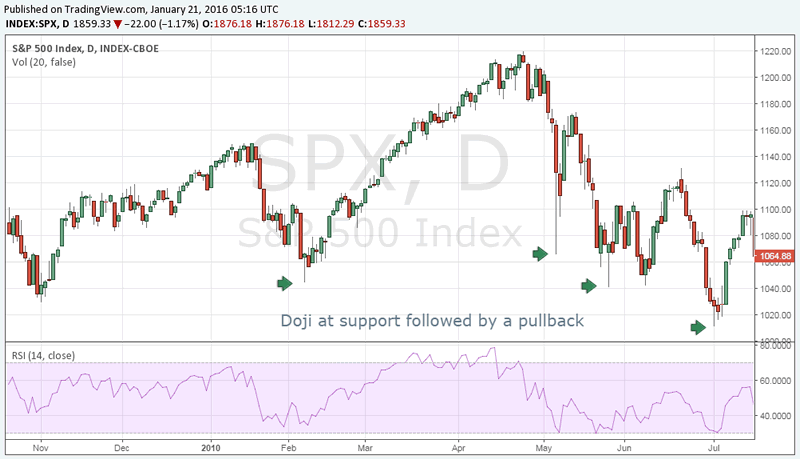
A Few Examples From 2006 - 2010
It is important to note that all Doji’s are not to be considered 100% valid. I consider only the Dojis, which are formed at an important support level,to be valid and RSI to be oversold and in the lower reversal zone.
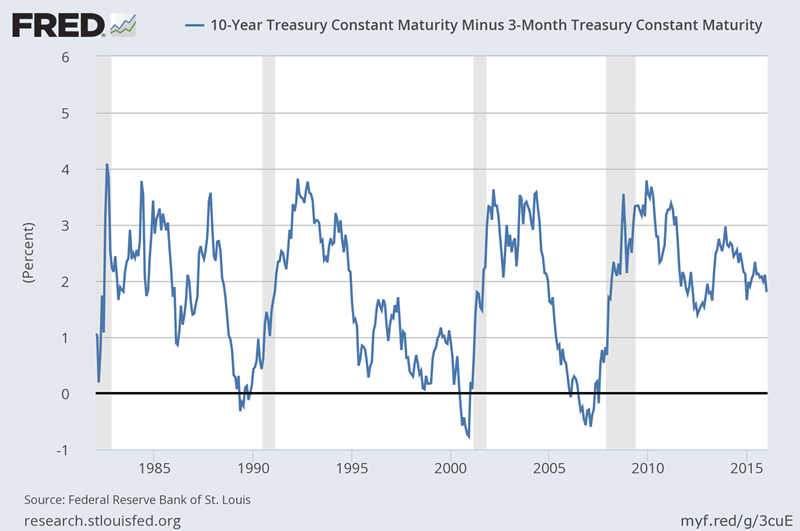
Leading indicator ‘Bond Market’ suggests there is still time before crash occurs
Every crash was preceded with the 10 year minus the 3 month Bond Yields by dropping towards the zero line. Although the equity markets have crashed, the bond markets are still not displaying any signs of panic. The indications from the bond markets should be respected, as they are a leading indicator.
This chart is upto date as of Jan 19th 2016, and its clear that the masses (investors) have not yet moved their capital into bonds which drives the percent down.
Conclusion:
During stage 3 market tops (final stage of a bull market) market participants are in “denial mode” while only the experts are liquidating their assets. The rest of the market participants realize too late that the market has turned bearish. By that time, they panic and start selling positions, whereas the experts realize that it is not time to buy yet and the average market participant forces the market down month after month with a steady stream of selling pressure. A bottom will not be found until the masses are finished selling their shares.
The volumes on January 20th, 2016, were on the higher side which indicated “panic selling”. Although, the markets are free to do what they like, my assumption and forecast is that around these levels, the markets are “bottoming out”. The markets are due for a rally, which will provide some positive returns, in the short-term.
Does this mean that the market decline is over and done with? Certainly not! The markets will once again turn, most likely, when all of the so called experts are calling for a “buy”. I will keep you informed, however, make sure you optin to my free email list so you don’t miss any further updates, videos and trading signals!
Join Fellow Trades and Myself at: www.TheGoldAndOilGuy.com
Chris Vermeulen
Join my email list FREE and get my next article which I will show you about a major opportunity in bonds and a rate spike – www.GoldAndOilGuy.com
Chris Vermeulen is Founder of the popular trading site TheGoldAndOilGuy.com. There he shares his highly successful, low-risk trading method. For 7 years Chris has been a leader in teaching others to skillfully trade in gold, oil, and silver in both bull and bear markets. Subscribers to his service depend on Chris' uniquely consistent investment opportunities that carry exceptionally low risk and high return.
Disclaimer: Nothing in this report should be construed as a solicitation to buy or sell any securities mentioned. Technical Traders Ltd., its owners and the author of this report are not registered broker-dealers or financial advisors. Before investing in any securities, you should consult with your financial advisor and a registered broker-dealer. Never make an investment based solely on what you read in an online or printed report, including this report, especially if the investment involves a small, thinly-traded company that isn’t well known. Technical Traders Ltd. and the author of this report has been paid by Cardiff Energy Corp. In addition, the author owns shares of Cardiff Energy Corp. and would also benefit from volume and price appreciation of its stock. The information provided here within should not be construed as a financial analysis but rather as an advertisement. The author’s views and opinions regarding the companies featured in reports are his own views and are based on information that he has researched independently and has received, which the author assumes to be reliable. Technical Traders Ltd. and the author of this report do not guarantee the accuracy, completeness, or usefulness of any content of this report, nor its fitness for any particular purpose. Lastly, the author does not guarantee that any of the companies mentioned in the reports will perform as expected, and any comparisons made to other companies may not be valid or come into effect.
Chris Vermeulen Archive |
© 2005-2022 http://www.MarketOracle.co.uk - The Market Oracle is a FREE Daily Financial Markets Analysis & Forecasting online publication.