


Gold, Silver, Bonds and Stocks Path Towards Inflation
Commodities / Gold and Silver 2016 Jun 30, 2016 - 04:05 PM GMTBy: Gary_Tanashian

 Yes, it’s another inflation post going up even as inflation expectations are in the dumper and casino patrons just cannot get enough of Treasury and Government bonds yielding 0%, near 0% and below 0%.
Feel free to tune out the lunatic inflation theories you’ve found at nftrh.com over the last few weeks. But if by chance you do want to look, here’s a visual path we have taken to arrive at the barn door, behind which are all those inflated chickens, roosting and waiting. All sorts of animals will get out of the barn if macro signals activate.
Gold led silver ever since the last inflationary blow off and blow out in early 2011. The gold-silver ratio rose through global deflation, US Goldilocks, good times and bad. There was no inflation problem, anywhere. Then early this year silver jerked leadership away from gold and now for the second time the ratio of gold to silver has broken below the moving average that has defined its trend (it did so in 2012 as well).
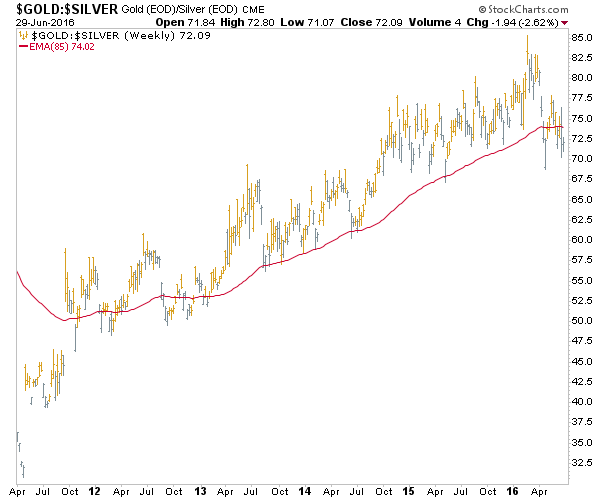
Why is this significant? Well, try on 2010 for size (see chart below). I for one happily managed the gold-silver ratio up spike in 2008, buying gold miners as they crashed. As gold (monetary, risk ‘off’) topped vs. silver (commodity/monetary, relatively risk ‘on’) we expanded the bullish view to commodities as well. But then came the bottoming pattern that was not a bottoming pattern. To this day I believe that the macro was preparing for a next leg up and some serious new destruction before Ben Bernanke, the “Hero”, sprung into action and ruined the beautiful Inverted H&S pattern that long-time NFTRH subscribers will remember me making a big deal about at the time.
The ratio got destroyed as the Bernanke Fed jammed a risk ‘on’ phase into gear with QE 2 and a great money making phase was on. Casino patrons, momos, black boxes and substance abusers could not help but make money, gurus pimped everything from Rare Earth Elements to Lithium to Copper.
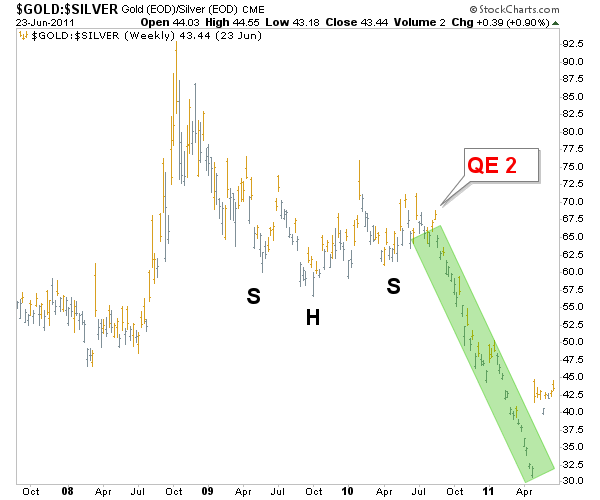
But then came the spring of 2011. Silver blew out and a dark phase, for most people not calling themselves US stock market bulls, ensued. You can see the end of the good times in 2011 on both charts above as Gold-Silver bottomed and turned up. The ratio has risen ever since. If – and it’s still an if – Gold-Silver breaks down again and inflation expectations rise, a large part of the world is going to get caught huddling in worthless paper yielding little, nothing or less than nothing even as deflation is indicated to have blown off. Here is the view of ‘inflation protected’ Treasury bonds vs. nominal T bonds.
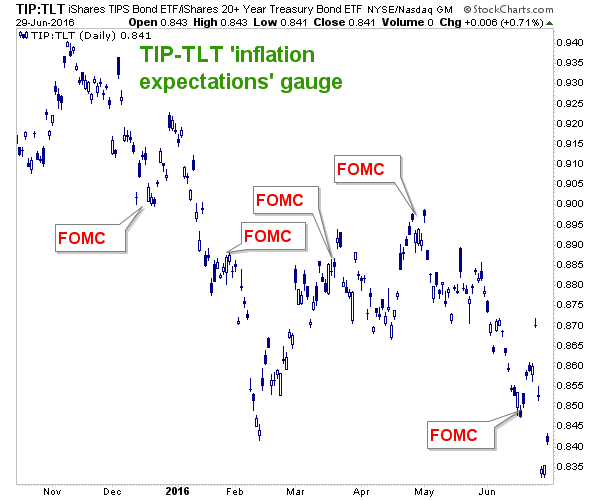
FOMC fretted about the lack of inflation and poor (backward looking) Payrolls, among other reasons for remaining dovish at its June meeting. Since then we have added the perfectly timed Brexit Theater to the mix and conventional market participants are firmly in line, buying debt paper up to bubble proportions.
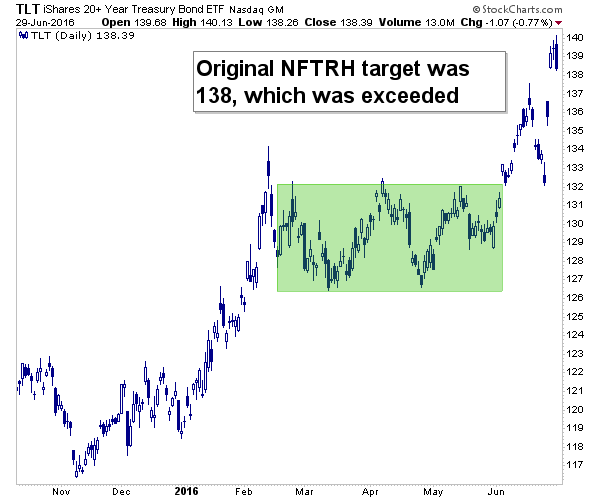
With this absolute rejection of inflation by global casino patrons, TLT (long-term Treasury) has been going gang busters pulling in frightened money the world over.
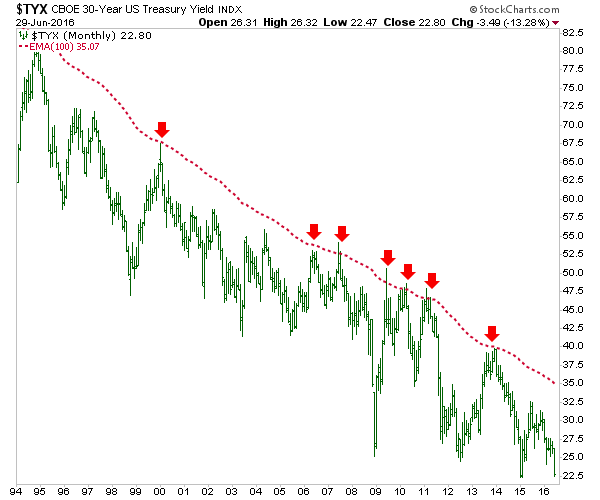
Here is the monthly view of the 30 year Treasury yield ‘Continuum’ ©. This paper actually pays some yield, unlike some of its fellows in the developed world. When deflation finishes blowing off, this will bottom and turn up with a new ‘inflation trade’. One day we may look to the limiter for the end of the next inflationary speculation phase but that, as you can see, is a long way off. Notice the red arrow at spring 2011? That is exactly why I call the EMA 100 “the limiter” ©. It worked perfectly in conjunction with the upturn in gold vs. silver to signal the end of the last great party.
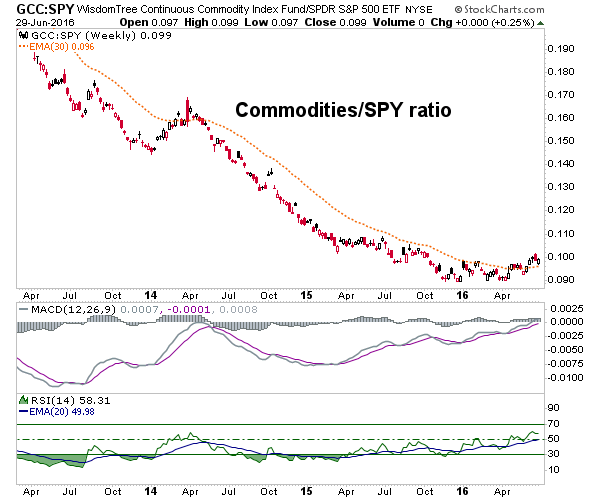
Moving on, with a hat tip to Brad Zigler per a previous post (Inflation is Brewing), commodities have been out performing the US stock market lately. Here’s my newly created chart (of SPY-GCC, idea appropriated from Mr. Zigler). Among other things, one message of this chart (assuming it goes on to change trend) is that though US stocks may not crash – and indeed, could even resume rising – Goldilocks (a condition where global deflation acted to suppress inflation signals in the US from 2012 to 2015) will have no place in the next phase.
We have been viewing the progression from deflationary to (would-be) inflationary with the Greenspan era blueprint in mind; where first, gold and gold miners got bid amid a stock market bear (still in play for a cycle, although the market had undone a lot of technical damage before the inflammatory and emotional Brexit drama played out), with silver and commodities catching on later and leading the first great ‘inflation trade’ of the new millennium. You can by the way, see where that one topped out in 2007 right at red arrow #3 on the Continuum chart above.
These are the financial markets and anything can happen, especially with US and global policy makers losing the firm grip of confidence with which they held casino patrons transfixed into 2015. But as a speculator you want to see something before the overwhelming majority sees it. As I have tried to illustrate above, I see something and NFTRH has been fleshing it out every week. Brexit was a transitory event that has helped keep the majority looking in the wrong direction. That’s good for you if you agree with my premise as laid out above.
Inflation is man-made, and it is promoted against the natural global deflationary force that has been trying to address the excess for the better part of 20 years now. While inflation may or may not one day end the system (in a Misesian “crack up boom”), it can be expected to periodically burp up phases that benefit speculators willing to go against the herd. Chances are such a phase is brewing now. We’ll of course update to hopefully affirm the analysis but if need be, revise, along the way.
Subscribe to NFTRH Premium for your 25-35 page weekly report, interim updates (including Key ETF charts) and NFTRH+ chart and trade ideas or the free eLetter for an introduction to our work. Or simply keep up to date with plenty of public content at NFTRH.com and Biiwii.com.
By Gary Tanashian
© 2016 Copyright Gary Tanashian - All Rights Reserved
Disclaimer: The above is a matter of opinion provided for general information purposes only and is not intended as investment advice. Information and analysis above are derived from sources and utilising methods believed to be reliable, but we cannot accept responsibility for any losses you may incur as a result of this analysis. Individuals should consult with their personal financial advisors.
Gary Tanashian Archive |
© 2005-2022 http://www.MarketOracle.co.uk - The Market Oracle is a FREE Daily Financial Markets Analysis & Forecasting online publication.