


What Will Happen To the Stock Market When Interest Rates Rise?
Stock-Markets / US Interest Rates Jul 22, 2016 - 11:14 AM GMT

 Interest rates have been in a freefall for the better part of the past two decades. Moreover, the yield on the 10-year US Treasury, which is the flagship interest rate benchmark, has mostly been below 2% since the beginning of 2012. The 10-year Treasury note did reach 3% by the end of 2013 but has promptly fallen ever since to its current level of 1.59 percent.
In contrast, the stock market as measured by the S&P 500 hovers at an all-time high. Moreover, after the stock market bottomed in February 2009 as a result of the Great Recession, stock market investors have enjoyed a strong bull market that is now almost halfway into its 8th year running. Interestingly, as it relates to the thesis of this article, the stock market had one of its best performances in 2013 in spite of the 10-year Treasury note rising from 1.78% to 3.04% by the end of the year. To be clear, in direct conflict with conventional wisdom, both the stock market and interest rates rose dramatically in 2013.
Conventional wisdom has historically suggested that there exists an inverse relationship between interest rates and stock valuations. The logic goes something like this. When interest rates fall, fixed income investments become less competitive because of their lower yields, and therefore, stocks become more attractive as a result. Conversely, when interest rates rise, fixed income investments become more competitive because of their higher yields, and therefore, stocks become less attractive as a result.
Personally, I’ve always considered this argument to be rational, even logical and sound. It seems to make good sense, because prudent and logically-thinking investors should always be asking a rational question before investing in a stock. Could I get a safer and better return if I invested in something else? Since the 10-year Treasury note is considered one of the safest investments of all, it makes further sense to compare your return expectations on a stock with the theoretically risk-free return of the 10-year Treasury note.
In Wall Street parlance this is often referred to as the “risk premium,” also known as the “equity risk premium.” Since investing in a stock involves greater risk, you should logically expect to earn a higher rate of return when investing in it. In other words, it is only rational to expect a higher rate of return that compensates you for the risk you are taking. Consequently, fixed income truly does become more competitive when interest rates are higher.
However, as logical as this is, it is only truly relevant when both markets are behaving within normal ranges. In economics the qualifying Latin term is “ceteris paribus” which loosely translates as all other things remaining equal or remaining the same. Unfortunately, the real world is often not so accommodating. All things do not remain equal or the same, therefore, other exogenous variables or factors can - and will - often come into play. As a result, the logical model between interest rates and stock values described above doesn’t always work out as expected. Interestingly, this exception to the rule has been the norm for most of the past couple of decades - as this article will illustrate.
Interest Rates and Stock Values Since 1997
As previously stated, I have always considered the theoretical inverse relationship between stock values and interest rates as being a logical assumption. Consequently, I even developed a graph as a component of the F.A.S.T. Graphs™ research tool that measured a stock’s P/E ratio in relation to the interest rate of a 10-year Treasury note. When I first developed this graph, I expected to see this inverse relationship neatly at work. When interest rates were falling, I expected to see P/E ratios moving in the opposite direction - and vice versa.
When I initially entered the industry in 1970, the inverse relationship between interest rates and the P/E ratio of the stock market worked perfectly up until approximately calendar year 2000. Later I will provide a graphic illustrating how perfectly the P/E ratio versus interest rate inverse relationship worked for much of my career. However, since calendar year 2000, both interest rates and the P/E ratio of the S&P 500 moved in lockstep with each other. Interest rates continued to fall and the P/E ratio of the S&P 500 also fell in the face of lower interest rates.
The following “PE Interest Rates” correlated graph clearly illustrates this fact. The dark blue line plots the year-end P/E ratio of the S&P 500 each year and the red line plots the interest rate of the 10-year Treasury bond. Clearly we see both falling in almost perfect lockstep with each other. This is a direct contradiction of what I expected based on the logic presented previously. Consequently, this raises the question: what could have caused both P/E ratios and interest rates to move in tandem since 2000?
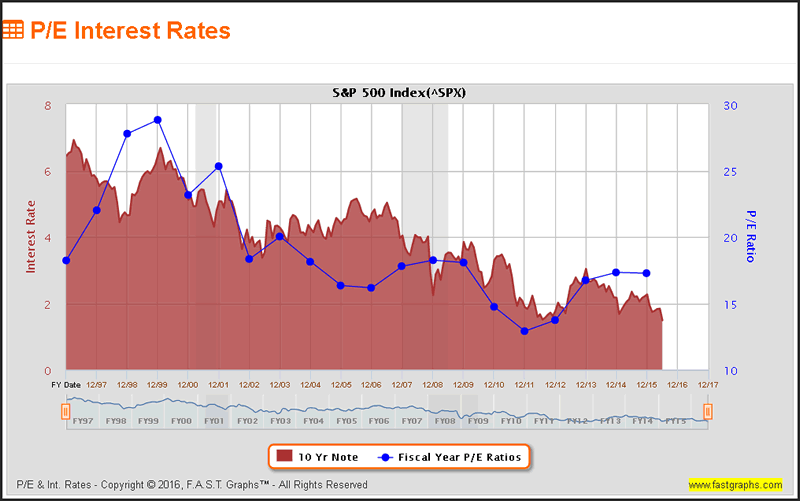
The answer becomes clear when you evaluate the level of the market’s (the S&P 500) valuation in calendar year 2000. At the beginning of 2000, the P/E ratio of the S&P 500 was 28.8, which is approximately double a more normal P/E ratio of 14 to 16. Consequently, this aberrantly high valuation for the S&P 500 was a headwind that even falling interest rates could not overcome. The P/E ratio of the S&P 500 had nowhere to go but down from these lofty heights. This is a classic example of one of the exogenous factors I referenced above. Simply stated, falling interest rates did not have the expected effect on stock valuations that logic theoretically dictated.
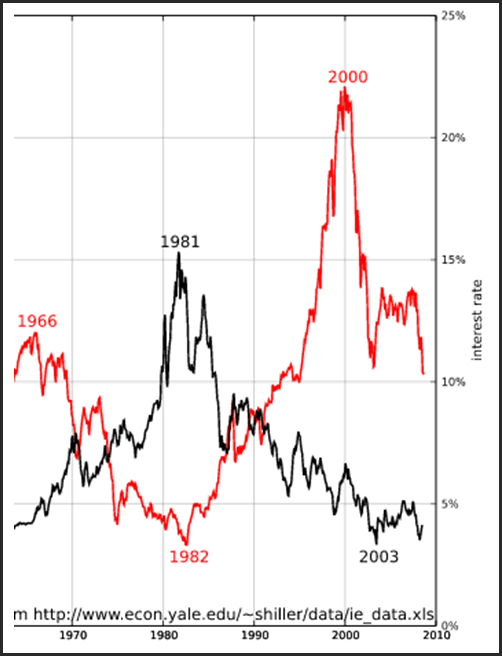
As indicated earlier, I stated that the inverse relationship between interest rates and stock valuations performed generally as expected for most of my career. The following excerpt of a longer-term graph, which I will present later, illustrates my point. The red line on the graph is interest rates, and the black line is the P/E ratio of the S&P 500. From approximately 1966 to 1982 interest rates fell and the P/E ratio of the S&P 500 rose as the model suggested. All was well with financial logic and modeling.
Then from 1982 to 2000 interest rates advanced strongly, and the P/E ratio of the S&P 500 dropped as a result - and as expected. Once again, all was well with financial logic and modeling. However, since calendar year 2000 the model appears broken. Interest rates continued to drop to record lows, and the P/E ratio of the S&P 500 also dropped along with interest rates. Clearly, during this period of time all things were not equal or the same.
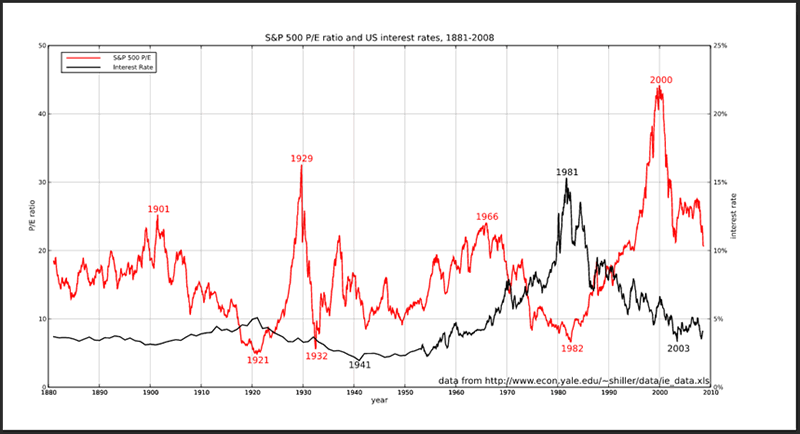
As promised, here is the entire graph illustrating the relationship of the P/E ratio of the S&P 500 to interest rates going back to 1881. What I believe this extremely long-term graph truly tells us is that there is some validity to the notion that P/E ratios and interest rates will move inversely. However, this long-term graph also illustrates that this logical relationship is not perfectly correlated. There are times when other factors will have an impact.
Consequently, I have concluded that the model suggesting that P/E ratios and interest rates will move inversely remains a rational assumption. However, evidence also suggests that other important factors come into play and can have a significant effect on our expectations. Therefore, I would suggest not putting too much emphasis on any one metric or factor, including interest rates.
The Inspiration for This Article
I was inspired to write this article because of a question I received from a regular reader in the comment section of my most previous article found here. This question/comment represents one of many I have received or have seen in my articles and in other articles written by other authors. I believe it speaks loudly to the thesis of this article, as well as part 2 of this series which will follow next. Moreover, I believe that both the question/comment and my response nicely summarizes the thesis of what I’m writing about here. Here is the question/comment:
“It seems we are now in an abnormal period with interest rates quite low and even negative in many countries. This means many companies are borrowing at low rates and using these funds to buy back shares and thus increase EPS and in turn cause PE Ratios to decline. On the other hand whenever a company buys back shares it means less market shares are available since the prior owners of the bought back shares now have more cash to invest and thus tend to drive up PE ratios. This may seem trivial however in the WSJ of 7/13 they showed buybacks were $161.39B or a rate of $645B per year. It would seem this additional $645B would be invested somewhere and with fixed income rates so low it would seem to be the stock market tending to push PE Ratios higher.
My question is do you consider this low interest rate environment we are in, and it seems to be ongoing, when making investment decisions and specifically pertaining to PE Ratios?”
Here is my response:
“Thanks for the question regarding my views on interest rates and their impact on P/E ratios. First of all, I want to make a distinction between calculations attempting to determine the intrinsic value of a business versus the valuation that the market may place on a stock from time to time.
The former is all about attempting to establish a value of the business based on the company’s earnings yield. A P/E ratio of 15 represents an earnings yield of approximately 6.67%. This essentially tells you how much yield you would be getting from the company’s earnings power as an investor. Importantly, this calculation is independent of interest rates. Additionally, this type of calculation is attempting to determine how sound or attractive an investment in any given company might be.
In contrast, the valuation that the market may apply at any given time is an entirely different matter altogether. There is a notion that P/E ratios will trend higher when interest rates are lower and vice versa. The logic behind this is based on the idea that bonds and other fixed income instruments become less competitive with stocks when rates are lower and more competitive when rates are higher. Therefore, the logic suggests that P/E ratios will be higher during periods of low interest rates and vice versa.
Interestingly, I developed a graph to analyze the relationship between P/E ratios and interest rates which is only available to premium subscribers to F.A.S.T. Graphs™. I developed this graph specifically based on that notion. However and here’s the interesting part, as interest rates have fallen over the last few decades, P/E ratios have actually fallen in tandem. The reason for this is because stock valuations were extremely high during the timeframe mid-1990s through the early 2000’s. Consequently, P/E ratios fell over time in spite of the fact that interest rates were getting lower.
Additionally, the high P/E ratios during the timeframe mid-1990s through the early 2000’s were occurring in spite of the fact that interest rates were high at the time. Consequently, the P/E ratio/interest rate relationship also belied logic at that time. My point being that interest rates are but one factor that might have an effect on how the market values businesses. However, it is only one of many other important factors.
Consequently, I prefer evaluating the value of a business based on the specific fundamental metrics that the business possesses and/or is producing. In other words, calculating the intrinsic value of a business based on fundamentals independent of exogenous factors such as interest rates etc.”
There are a couple of important takeaways from my response that I would like to focus the reader’s attention on. The first is the point I made that valuations were aberrantly high during the timeframe mid-90s to early 2000’s which was also a period of peaking interest rates. In other words, stock valuations were very high even though interest rates were also very high.
The next takeaway is the fact that both stock valuations and interest rates dropped in tandem from 2000 to current time. However, even though that has occurred, current stock valuations in general are nevertheless currently abnormally high. Yes, they have fallen from their peaks in 2000, yet I believe the market is still moderately overvalued, although not as overvalued as it was in calendar year 2000.
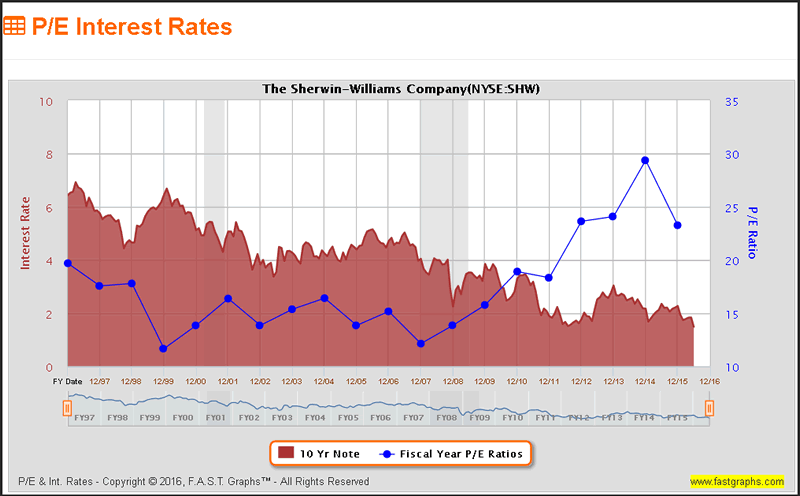
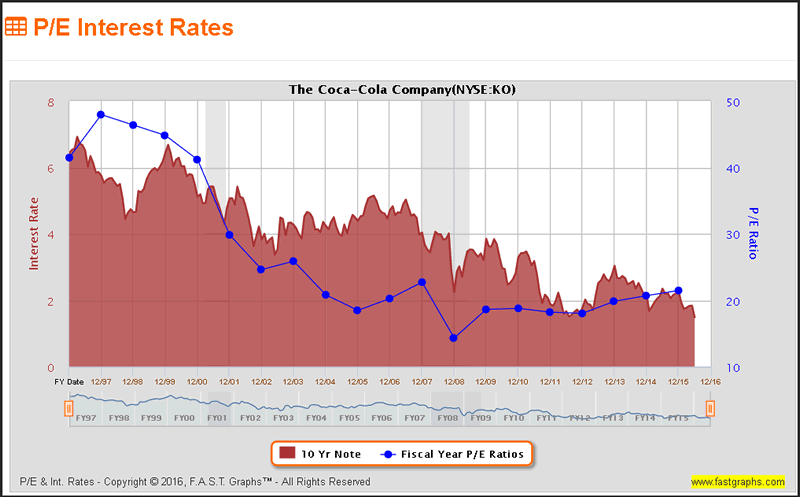
The P/E Ratio versus Interest Rates on Several Prominent Dividend Aristocrats
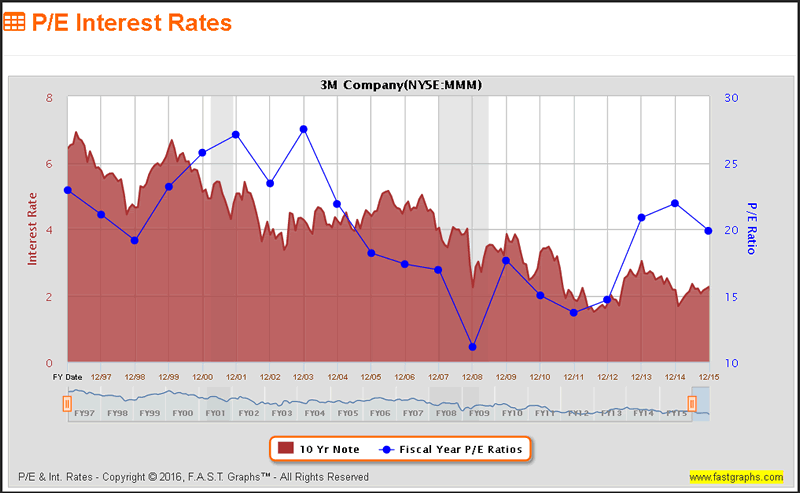
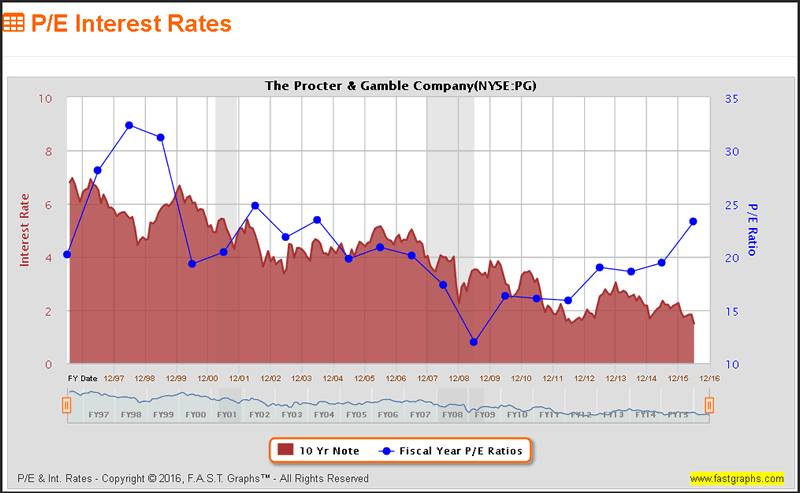
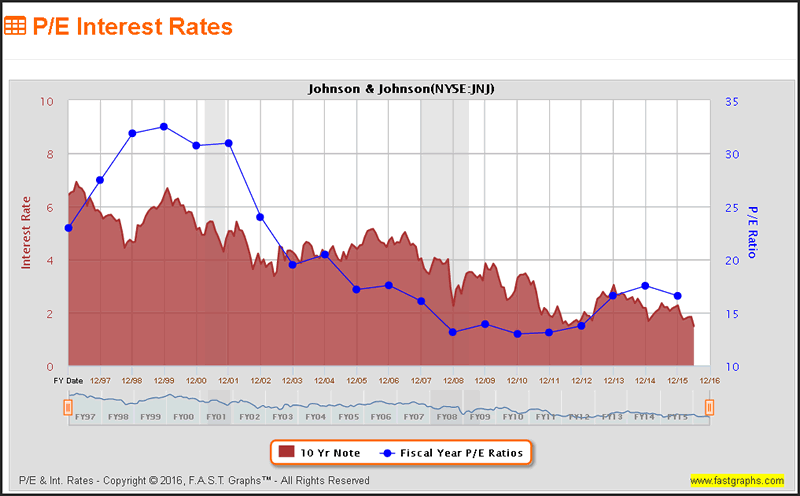
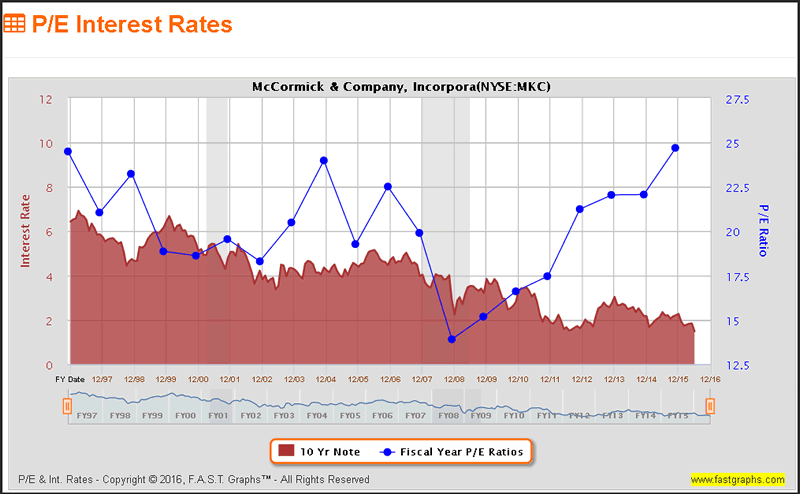
For additional insights, or perhaps additional confusion, I offer the following “PE Interest Rates” graphs on several prominent Dividend Aristocrats since 1997. What I believe these graphs illustrate is the reality that there is not a direct impact on valuations based solely on interest rates. Additionally, I believe these graphs illustrate that excessive overvaluation during the irrational exuberance timeframe, which culminated in calendar year 2000, had a greater impact on stock valuations than interest rates did.
3M Company (MMM)
Procter & Gamble Company (PG)
Johnson & Johnson (JNJ)
McCormick & Company (MKC)
The Sherwin-Williams Company (SHW)
The Coca-Cola Company (KO)
Summary and Conclusions
When I have money available for investment in common stocks, my primary focus is always on the specific financial health and valuation of the individual business I am considering. My principal questions are how strong is the business’ past, present and future, and more importantly, is it currently available at an attractive valuation based on its fundamental merits? This is often referred to as a bottom-up approach to investing. This is in contrast to a top-down approach that attempts to focus on macro factors instead of micro factors.
My experience has taught me that the strongest companies with the best management teams figure out how to perform under all economic environments to include interest rates. My favorite companies demonstrate profitability to include dividend growth whether we are in a booming economy or recession. I do not invest in the economy, instead, I strive to invest in the best companies I can find when their valuations are sound, or better yet, when they are undervalued.
Therefore, when I am investing in best-of-breed companies at sound valuations, I’m attracted to the fact that these companies have proven strong and successful regardless of the economic environment. To me, this speaks volumes about the quality of the companies and the skills of their management teams. Since I don’t intend on directly running these companies, I look for companies where I can have confidence that management will be able to navigate the ever-changing economic landscape and climate.
Nevertheless, in part 2, I will turn my attention to interest rates and their potential effects on the general economy. To me there is a significant distinction between the economic impacts of changes in interest rates in contrast to how it might affect the valuations of the individual companies I am specifically invested in. Prudence suggests that it is more difficult for a company to grow during challenging economic environments.
Therefore, I feel it is only prudent to evaluate what effect future economic conditions might have on my specific investments. However, I am confident that fairly valued companies will fare better going into challenging economic environments than overvalued companies will. This is only one of many reasons that I am so focused on investing only when fair valuation or undervaluation is manifest.
Disclosure: Long PG,JNJ,KO
By Chuck Carnevale
Charles (Chuck) C. Carnevale is the creator of F.A.S.T. Graphs™. Chuck is also co-founder of an investment management firm. He has been working in the securities industry since 1970: he has been a partner with a private NYSE member firm, the President of a NASD firm, Vice President and Regional Marketing Director for a major AMEX listed company, and an Associate Vice President and Investment Consulting Services Coordinator for a major NYSE member firm. Prior to forming his own investment firm, he was a partner in a 30-year-old established registered investment advisory in Tampa, Florida. Chuck holds a Bachelor of Science in Economics and Finance from the University of Tampa. Chuck is a sought-after public speaker who is very passionate about spreading the critical message of prudence in money management. Chuck is a Veteran of the Vietnam War and was awarded both the Bronze Star and the Vietnam Honor Medal.
© 2016 Copyright Charles (Chuck) C. Carnevale - All Rights Reserved Disclaimer: The above is a matter of opinion provided for general information purposes only and is not intended as investment advice. Information and analysis above are derived from sources and utilising methods believed to be reliable, but we cannot accept responsibility for any losses you may incur as a result of this analysis. Individuals should consult with their personal financial advisors.
Chuck Carnevale Archive |
© 2005-2022 http://www.MarketOracle.co.uk - The Market Oracle is a FREE Daily Financial Markets Analysis & Forecasting online publication.