


Surprise! It's the Greenspan Era Blueprint on Inflation
Stock-Markets / Financial Markets 2016 Aug 19, 2016 - 07:08 PM GMTBy: Gary_Tanashian

I realize Gomer Pyle was way before the time of much of my reading audience, but for the last few weeks I’ve been hearing him in my head as not only NFTRH, but now the wider financial media get on the idea that things are not as bad as had been generally perceived going into the hype fest known as Brexit. Most recently, a writer who always keeps an even keel, Chris Ciovacco, has summarized the situation nicely (as posted at Biiwii).
But we need to be forward looking at all times. From NFTRH 404 over a month ago…
“…economic data continue to be a mixed bag, but have started to improve lately,
as we expected would be the case. From Yardeni.com per the noted sources, here are a
couple of views of the ‘Economic Surprise’ index [omitted for this post] with the S&P 500’s price and P/E. This is another view stating that those who have been predicting gloom in the face of recent market turbulence have been playing last year’s game. The thing about surprises is that they are only surprises for those depending only on backward looking data.”
That was a confirmation of our existing stance. So what was the forward looking data? Well, I have belabored that over and over again so if you visit nftrh.com regularly you don’t need me to go into detail. We’ll just pop up the graphics again so that there is no confusion as to who was early to this party (I am the guy standing by the punch bowl with the ladle and the red plastic cups, serving but not partaking or reveling, due to my designated driver status).
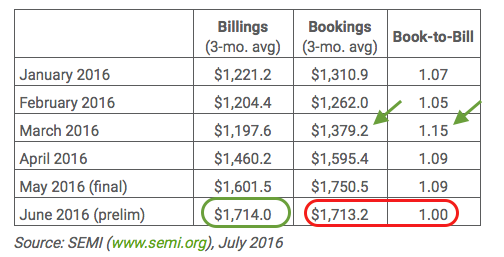
In April we noted a rise in March Semi Equipment bookings. In May we noted a big ramp for April. In June we noted continued strength for May and a new (3 month) trend.
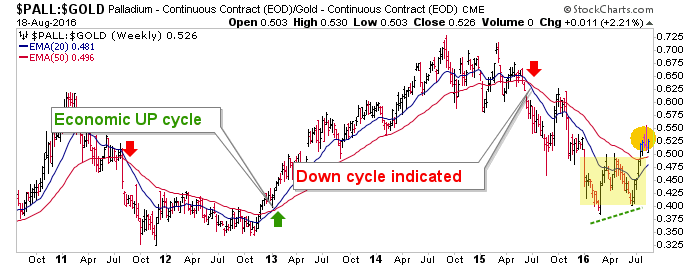
We then cross referenced with a fellow indicator that worked well as a cyclical indicator in early 2013, the Palladium-Gold ratio, which had started to bounce. First a bullish ‘W’ pattern was noted and then, the break above the moving averages. If the moving averages cross upward (something about which I have my doubts) and SEMI remains strong, you do not want to be a bear until these conditions are undone.
All of this happened while most market participants (evidently including the quant machines and techno charting whiz kids) were flat out bearish. Over bearish sentiment said so and the eye test said so. The media were in full frontal fear mode. But there was a SEMI trend and there was a PALL-Gold ‘W’ arguing bullish. Since those were my tools, I had to follow them. I mean, you can’t just not use your tools if you disagree with what they say.
And now here is the Surprise Index, from the noted sources by way of Yardeni.com…
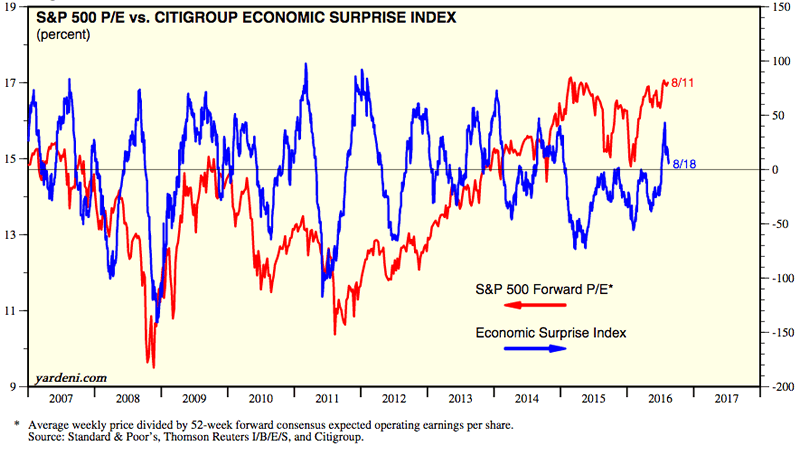
Well surprise! It appears the graph noted in Mr. Ciovacco’s article is a bit dated. The index has turned down and indeed I am taking nothing (including SEMI and PALL-Gold) for granted. That is because I expect this ‘breadth thrust’ market breakout to either be a prelude to a crash or at best, a suck-in to an eventual grinding bear market. The timing is the thing. We are operating on a 6 month horizon and are about 2 months in. But this thing could be shorter or much longer than that. It takes ongoing work, folks. No substitute for it; certainly not ego or the fantasy that you can predict the markets.
Again in reference to Mr. Ciovacco’s article, I’d agree that the rally is about more than Central Banking inputs, but let’s be clear about the primary and original underpinning; it is a relentless refusal – despite the goofy media jawbones – to even attempt to normalize monetary policy by the Federal Reserve. Hot money is literally being scared into the stock market as certain areas within the economy gain traction.
This is indeed a party and make no mistake that there is an element of mania and desperation to it. That is probably the main reason to look for an eventual flame out and crash when it ends. In the far reaching, scattered and ultimately unsatisfying NFTRH 408 (look, if I’m going to promo I’m also going to express when I think I’ve not produced my best work) we dug up some history for the American Association of Individual Investors (AAII). Maybe this whole thing, this whole breadth thrust upward and potentially manic suck-in, was all about getting AAII members to finally give in. Here’s an excerpt from #408…
<begin excerpt>
Individual Investors are not quite the consistent contrary indicator many think they are. They are grudgingly increasing their bullishness very slowly. From AAII…
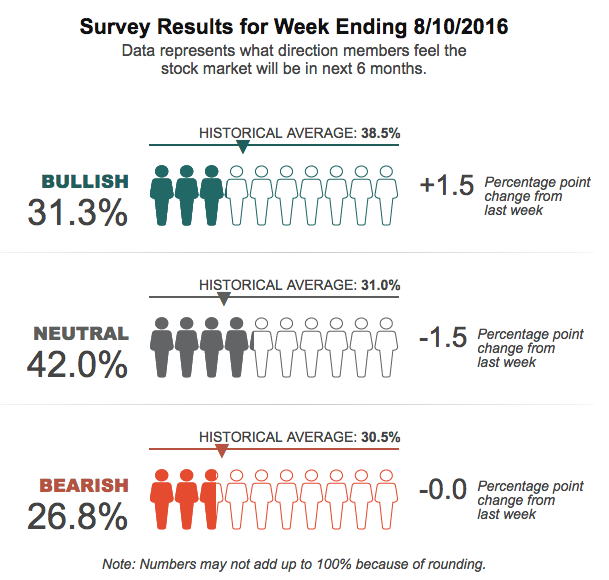
“Bullish sentiment is above 30% for the fifth time in six weeks; similar such streaks have only occurred two other times over the past 12 months.” And…
“This week’s special question asked AAII members how, if at all, they have adjusted their investing strategy recently. More than half of all respondents (55%) said they are focusing on or have shifted more into stocks, particularly value and dividend-paying stocks. Slightly more than 27% of respondents say they have not changed their strategy. Nearly 12% said they are increasing their cash allocation. About 8% said they are taking a more conservative approach. Some respondents listed more than one than one asset class or investing style.”
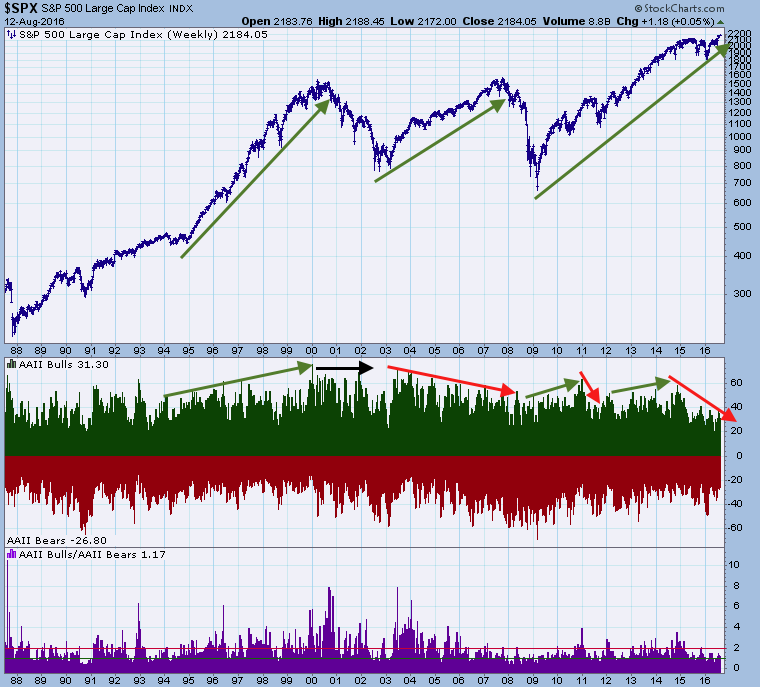
Here is the AAII in the context of post-2009 history, from Stockcharts.com…
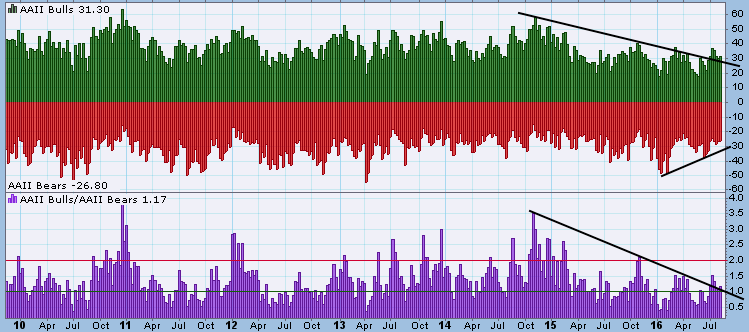
A longer view shows that AAII members really took personally the fact that they got more bullish as the blow off phase (1995 to 2000) of the 1980-2000 secular bull market progressed, and then failed to stop being bullish during much of the ensuing bear market, only to capitulate as the market made a higher low in 2003, which was the ‘buy’ signal on the new cyclical bull market. AAII was a massive contrary indicator on that cycle.
AAII remained a contrary indicator in fading the 2003-2007 bull market from start to finish. Sure, they were very well prepared for the crash of 2008 (due to non-participation in the bull) and even used contrarian sentiment to their advantage (getting long in 2009-2010) until the 2011 fake out correction (the ‘2011 comp’) that we talk so much about.
More recently, AAII did okay in riding the bull in 2013-2015, but have been increasingly bearish since Q4 2014 (ref. the Semiconductor sector’s implosion that never should have been, courtesy of Microchip Semi’s bogus guidance and a heaping helping of negative hype) due to the market’s topping pattern that was built out from late 2014 to early 2016. Now, the rubber meets the road. Is AAII the final component to close the loop? Will they finally forgive themselves for 1995-2007? Is AAII the last contrarian man standing?
<end excerpt>
Is that really what this is all about? Are we closing the loop on the 1995-2007 era, presided over by Alan Greenspan? We are after all, operating to a general version of the ‘Greenspan Blueprint’ and its cyclical bull market from 2003-2007. That was a time when gold bottomed first, and then silver and commodities bottomed… and stocks did too.
What do we have here today? Gold bottomed and took the lead on commodities (including silver) but its leadership has now broken down vs. silver, palladium and possibly even crude oil.
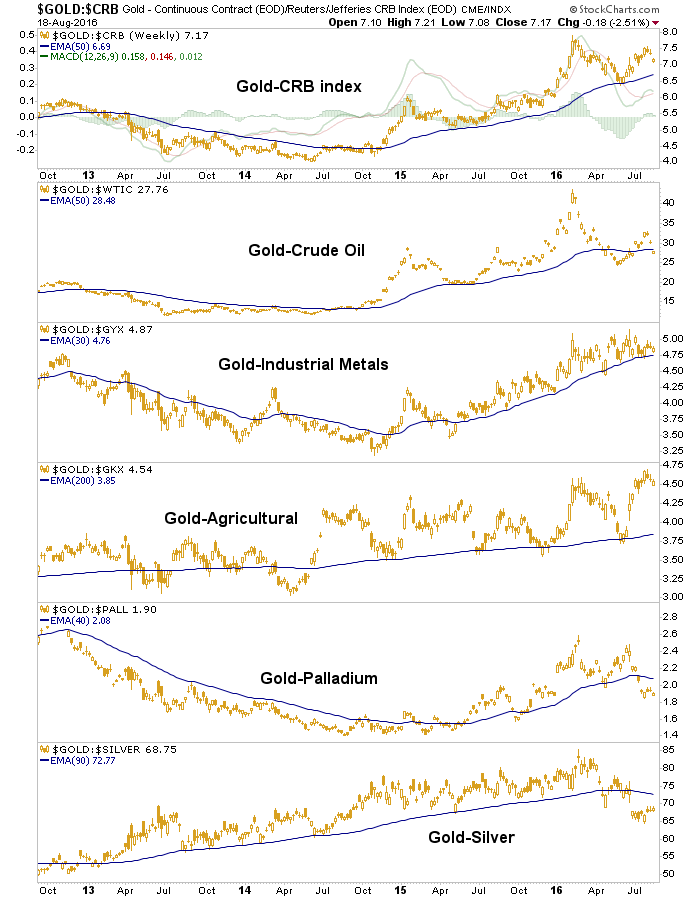
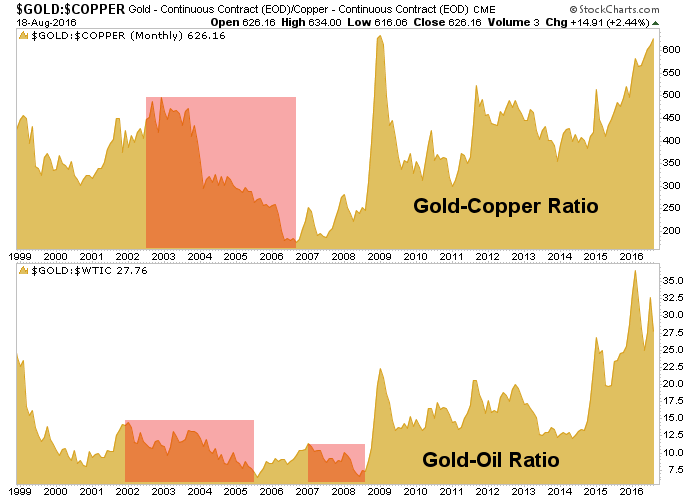
That is an inflationary signal in the making, folks. And after all, our theme has been an economic bounce just as in 2003. But it is also indicated to be an inflationary bounce. Just as in 2003. From that point on gold mostly flat lined vs. commodities and even under performed some key ones like crude oil and copper.
Clear the media noise and get this; gold leads out of deflation and into new inflationary cycles.
By this chart we are at the equivalent of 2003. Now, how long will this cycle last? Again, I have my doubts about it being anywhere near the ’03 to ’07 cycle in length. But for now, it’s bullish and it is potentially inflationary, with holdout indicators being Treasury yield spreads and ‘inflation protected’ vs. nominal T bonds.
But they say that the Treasury market is manipulated. What ever could give them that idea (cough cough… Op/Twist… cough cough… “sanitize inflation”… nothing to see here, move along).
As of now, the balance of the indicators say inflation. We even have a Fed president talking up inflation (the first jawbone in this post). I wonder why. Because maybe it is easier to deal with debt when you are inflating than when you are raising interest rates? Surprise!
If the indicators come to say we are not on such a path, we will note it. Meanwhile it looks like Full Frontal Greenspan… or even something potentially more intense,
Subscribe to NFTRH Premium for your 25-35 page weekly report, interim updates (including Key ETF charts) and NFTRH+ chart and trade ideas or the free eLetter for an introduction to our work. Or simply keep up to date with plenty of public content at NFTRH.com and Biiwii.com.
By Gary Tanashian
© 2016 Copyright Gary Tanashian - All Rights Reserved
Disclaimer: The above is a matter of opinion provided for general information purposes only and is not intended as investment advice. Information and analysis above are derived from sources and utilising methods believed to be reliable, but we cannot accept responsibility for any losses you may incur as a result of this analysis. Individuals should consult with their personal financial advisors.
Gary Tanashian Archive |
© 2005-2022 http://www.MarketOracle.co.uk - The Market Oracle is a FREE Daily Financial Markets Analysis & Forecasting online publication.