


Sugar Price Set To Correct
Commodities / Agricultural Commodities Sep 09, 2016 - 12:28 PM GMTBy: Austin_Galt

 The sugar price has experienced a solid move up off the lows putting in a high back in July at $21.10. Since then price looks to be in a process of distribution and I expect a more substantial correction to take place.
Let's take a bottom up approach to the analysis beginning with the daily chart.
Sugar Daily Chart
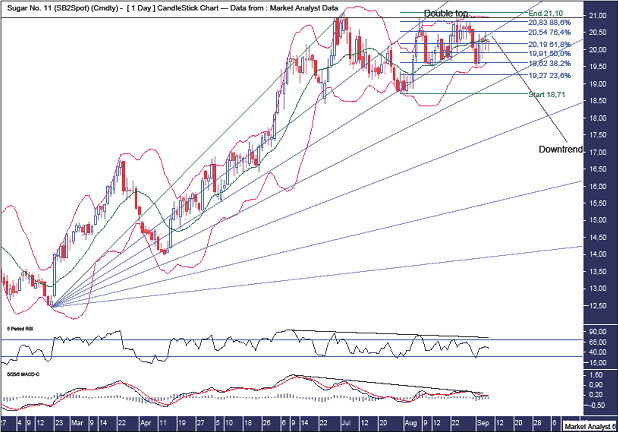
We can see this 2 month period of accumulation and distribution since the 5th July 2016 high. Of course, it is possible for price to now launch to new highs but I favour the other side of the coin to land with a move down.
The Bollinger Bands show price bouncing up and down between the higher and lower bands with price currently around the middle band. I doubt price will now get back up to the upper band and believe a solid move lower is just around the corner.
The horizontal line denotes a bearish double top that has formed during this distribution phase at the $20.94 level and price breaking above there now would likely nullify this analysis.
I have added Fibonacci retracement levels of the move down from top to low and this double top clipped the 88.6% level so a deep retracement which is consistent for the first rally in a new bear trend.
I have drawn a Fibonacci Fan from the February 2016 low to high. This shows price finding support after the high at the 38.2% angle with the next high being at resistance from the 23.6% angle, Price has now broken below the 38.2% angle which now represents resistance. Price is now testing this resistance and I expect it to send price back down shortly.
The RSI and MACD indicator both showed a bearish divergence at the high and have continued to trend down ever since.
Sugar Weekly Chart
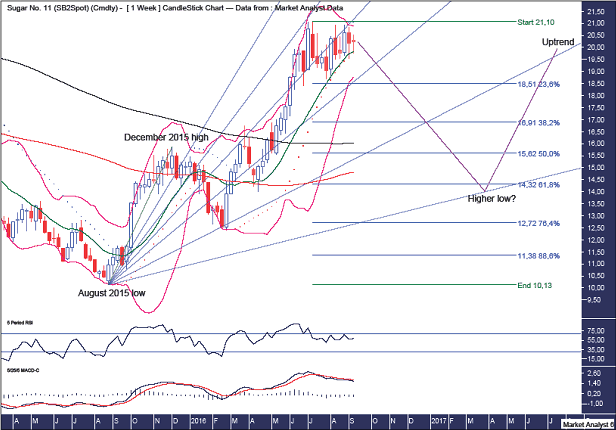
The Bollinger Bands show the bands tightening with price finding support at the middle band. I favour this support to give way shortly.
The PSAR indicator is my super loose setting and has now turned bearish with the dots above price.
I have drawn a Fibonacci Fan from the August 2015 low to first swing high in December 2015. This shows the February 2016 low at support from the 76.4% angle with price subsequently shooting much higher with the high just below resistance from the 38.2% angle. Price has now broken below support from the 50% angle and looks to be struggling to keep in touch. I expect price to give up shortly and make its way to the next angle beyond with the final higher low to be around support from the 88.6% angle.
I have added Fibonacci retracement levels of the whole move higher. Looking retroactively, the February 2016 low was around support from the 76.4% level so I expect the next higher low to be up around the next support area which is the 61.8% level at $14.32.
The December 2015 high at $15.85 now represents support and I favour price to push below that level as it gives that support a thorough test.
The moving averages with time periods of 100 (red) and 200 (black) are still in bearish formation so it is probably being a bit optimistic to expect another surge higher while this remains the case. Well, certainly not an extended surge higher.
The RSI recently made a new high which is bullish for the longer term but perhaps a move back to near oversold territory will occur over the shorter term.
The MACD indicator is currently bearish.
Let's wrap things up with the monthly chart.
Sugar Monthly Chart
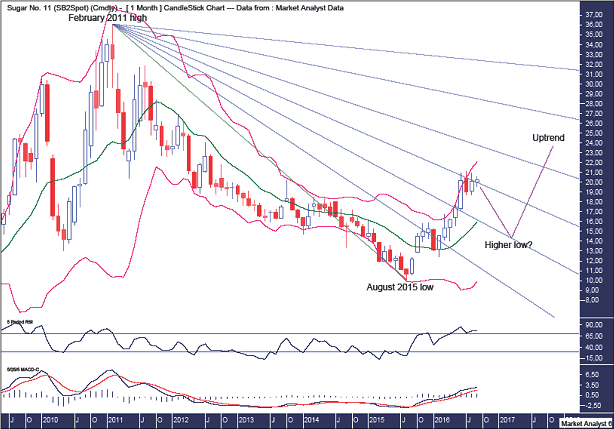
The Bollinger Bands show price appearing to be starting to move away from the upper band. This doesn't rule out price having another lash at the upper band but as it stands currently I favour a move back to the middle band at the minimum and possibly even the lower band given the fullness of time.
I have drawn a Fibonacci Fan from the February 2011 high to August 2015 low. Price now seems to be encountering resistance at the 50% angle and I favour a correction back to support from the 38.2% angle.
The RSI is looking strong but might need a breather while the same could be said of the MACD indicator which remains bullish.
Summing up, I believe a more substantial correction is set to occur over the intermediate term after which the bull trend should resume taking price even higher. If I am wrong about the high being in place then I would imagine a marginal false break only playing out.
By Austin Galt
Austin Galt is The Voodoo Analyst. I have studied charts for over 20 years and am currently a private trader. Several years ago I worked as a licensed advisor with a well known Australian stock broker. While there was an abundance of fundamental analysts, there seemed to be a dearth of technical analysts. My aim here is to provide my view of technical analysis that is both intriguing and misunderstood by many. I like to refer to it as the black magic of stock market analysis.
Email - info@thevoodooanalyst.com
© 2016 Copyright The Voodoo Analyst - All Rights Reserved
Disclaimer: The above is a matter of opinion provided for general information purposes only and is not intended as investment advice. Information and analysis above are derived from sources and utilising methods believed to be reliable, but we cannot accept responsibility for any losses you may incur as a result of this analysis. Individuals should consult with their personal financial advisors.
Austin Galt Archive |
© 2005-2022 http://www.MarketOracle.co.uk - The Market Oracle is a FREE Daily Financial Markets Analysis & Forecasting online publication.