


Financial Markets and FX Setups 27th Sept
Stock-Markets / Financial Markets 2016 Sep 27, 2016 - 05:05 PM GMTBy: Submissions

 Joy Mesh writes: The analysis for markets and various inter connected price action which will allow our clients to be better placed. Major markets around the globe sold off yesterday. The source of the anxiety may have been the presidential debate. S&P 500 plunged at the open and, after a puny bounce, sold off to a narrow mid-afternoon trading range. The yield on the 10-year note closed at 1.59%, down three basis points from the previous close. Here is a snapshot of past five sessions in the S&P 500.
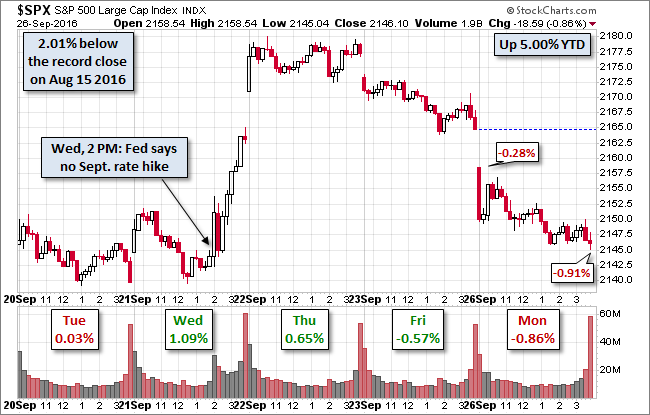
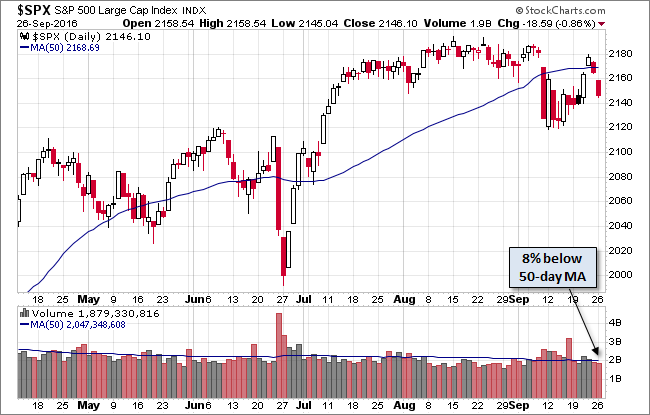
The index closed with a 0.86% loss, a tad above its 0.91% intraday low moments before the close. Today's loss essentially erased the no-rate-hike rally that began last Wednesday with the release of the September FOMC statement.
However the volume was unremarkable suggesting major particpants stayed away.
CRB Index: Price action muted
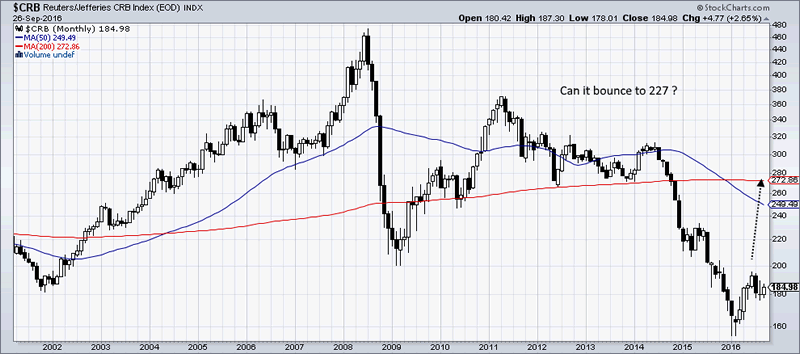
The long term CRB index provides us a top view into world of commodities. We are off the multi year and decade lows. In the grand scheme of things, it is just a minor bounce which is why the current recovery of the last 5 years looks dismal. Manufacturing and mining which directly derive their prospects from commodities prices show dismal job growths and this is set to continue. However the 200 Monthly moving average which does not easily get swayed is flat. It is entirely possible we could see a nearly 20% jump to 227 levels in the coming months. This can brighten prospects of commotity currencies like CAD and AUD.
Commodity demand is picking up
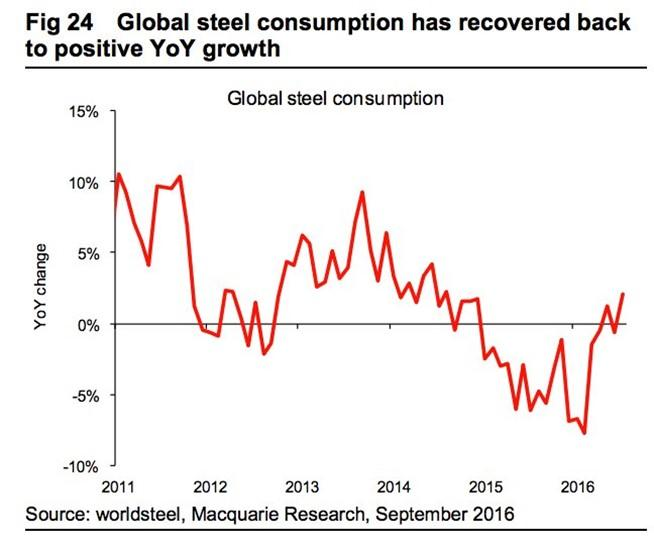
Global steel production is again positive.
US Market ETF analysis
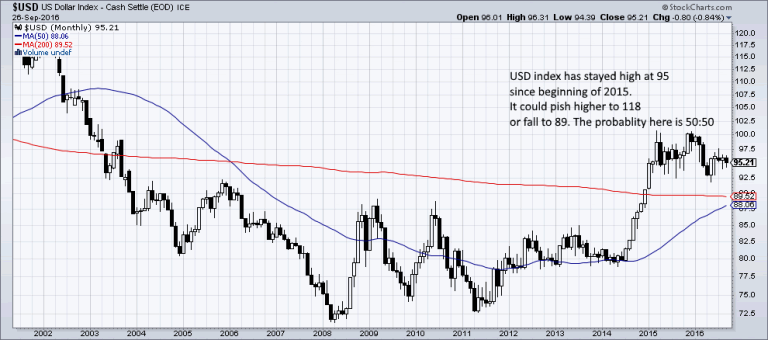
The USD dollar index long term chart is a 50:50 chart. This kind of pattern where prices consolidate at the highs or just off the highs suggest that the bulls are going to it higher but the wait will torment them and allow naive bear to push it down as well. There are two levels on either side of the current price. The upside is to 118 while the downside is 89. The upside risk currently outweigh the downside risk. Couple of FED hikes can take it to 118.
Financial suffer while yield assets soar
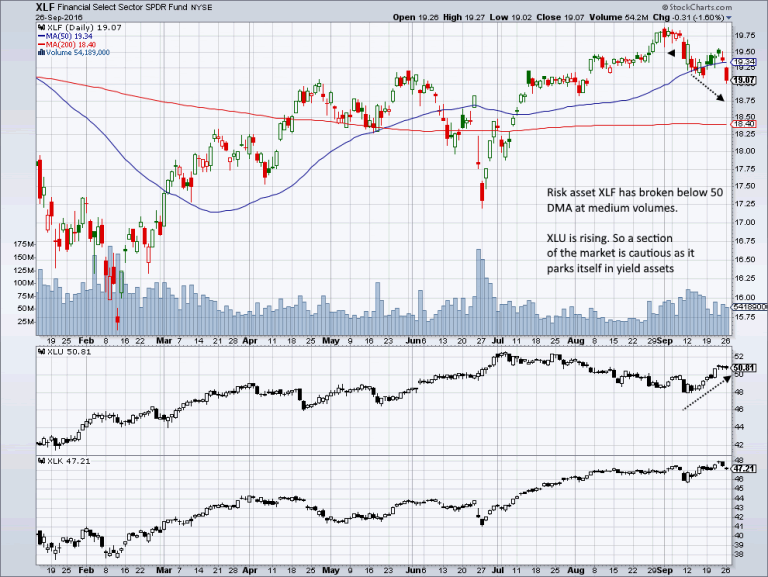
XLF - financial ETF which is represectative of market risk taking ability - is below the 50 DMA. Currently market is not very optimistic of a run away risk rally. At the same time, XLU - utilities ETF has maintained upward mobility. Thus cash is parked in defensive.
Real Estate: Bellweather of the bull run
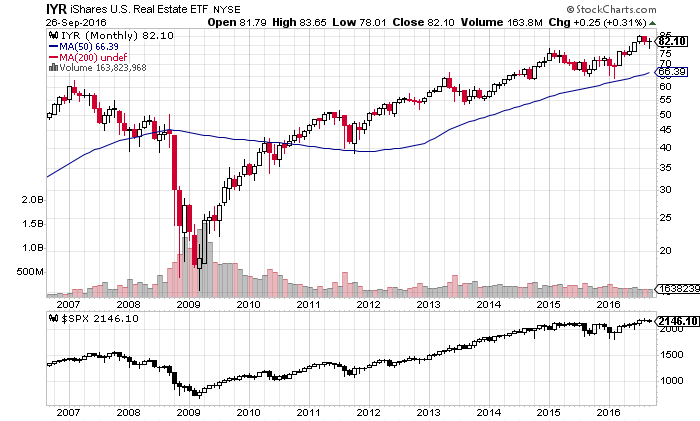
Real Estate sector is steadily rising. No sign of any weakness. Even potential fed hikes has not slowed the momentum of the money flowing into IYR (Real Estate ETF). Since 2009, it has sustained the S&P 500 and thus is foundational to health of the index. The IYR has broken to new highs at 82 while S&P500 is still under the all time highs. Is a new high coming?
Building permits increased by 3.7%. This is a good leading indicator for housing.
Housing is on solid footing
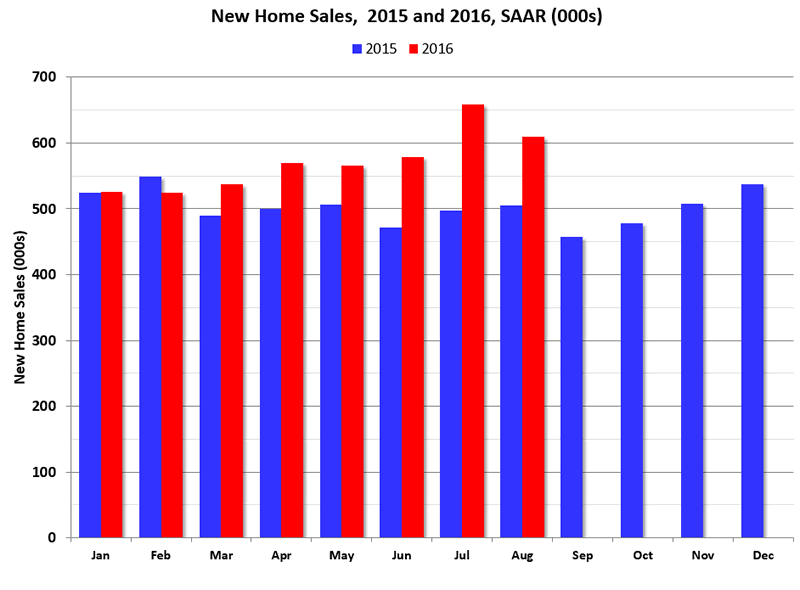
Sales to date are up 13.3% year-over-year, because of very strong year-over-year growth over the last five months.
Calculated Risk points out
The new home sales report for August was strong at 609,000 on a seasonally adjusted annual rate basis (SAAR) - the highest for the month of August since 2007 - and the second highest sales rate since January 2008 (only last month was higher). However combined sales for May, June and July were revised down slightly. Sales were up 20.6% year-over-year (YoY) compared to August 2015. And sales are up 13.3% year-to-date compared to the same period in 2015. This is very solid year-over-year growth. And new home sales are much more important for jobs and the economy than existing home sales. Since existing sales are existing stock, the only direct contribution to GDP is the broker's commission. There is usually some additional spending with an existing home purchase - new furniture, etc - but overall the economic impact is small compared to a new home sale.
Inflation: Core is starting to point higher
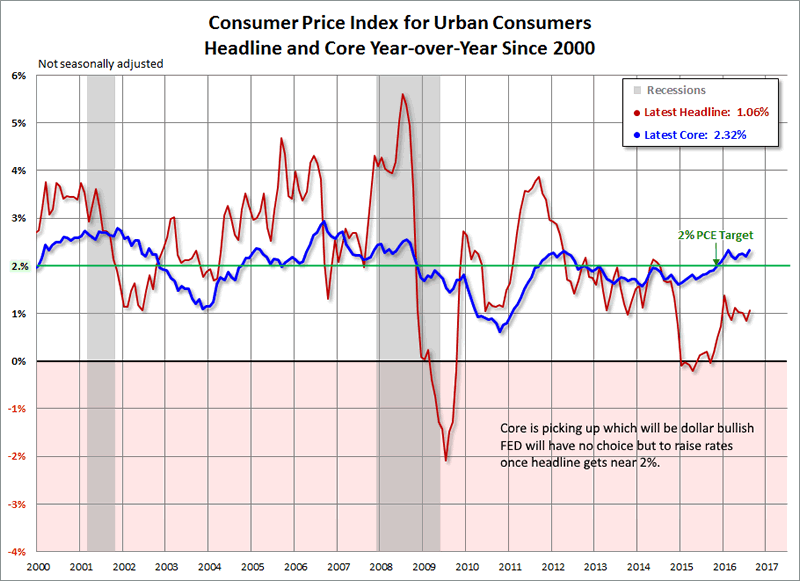
We believe much of the dollar bullish stance at 95 and its upward continuance could be from the rising inflation trajectory. Fed may have no choice but to start being vigilant against rising prices.
Data today will include:
Tuesday:
• At 9:00 AM ET, S&P/Case-Shiller House Price Index for July. Although this is the July report, it is really a 3 month average of May, June and July prices. The consensus is for a 5.2% year-over-year increase in the Comp 20 index for July. The Zillow forecast is for the National Index to increase 5.0% year-over-year in July.
• At 10:00 AM, Richmond Fed Survey of Manufacturing Activity for September. This is the last of the regional Fed surveys for September.
Final Thought
We see no signs of weakness in broader risk market. We fully expect the equity indices to creep higher unless something changes. The trend is higher and we stay invested.
JM is the partner at FXMesh. Over 15 years of trading, hedge fund and research experince background, he now provides investment advice and economic reasearch to clients around the world from his site http://fxmesh.com
He has worked at some of the most marquee names in trading and hedge fund industry. He invented the MESH Framework of trading. He will also like publish regular free articles at marketoracle for benefit of the readers.
Copyright 2016 Joy Mesh. All rights reserved.
Disclaimer: The above information is not intended as investment advice. Market timers can and do make mistakes. The above analysis is believed to be reliable, but we cannot be responsible for losses should they occur as a result of using this information. This article is intended for educational purposes only. Past performance is never a guarantee of future performance.
© 2005-2022 http://www.MarketOracle.co.uk - The Market Oracle is a FREE Daily Financial Markets Analysis & Forecasting online publication.