


Stock Market Reluctant Selling
Stock-Markets / Stock Markets 2016 Oct 31, 2016 - 01:39 AM GMTBy: Andre_Gratian

 Current Position of the Market
SPX Long-term trend: The long-term trend is up but weakening. Potential final phase of bull market.
SPX Intermediate trend: The uptrend from 1810 continues, but it has entered a corrective phase which could extend into November.
Analysis of the short-term trend is done on a daily basis with the help of hourly charts. It is an important adjunct to the analysis of daily and weekly charts which discuss longer market trends.
Reluctant Selling
Market Overview
The market continues to work itself lower at a snail’s pace. If this continues for the next three weeks, this will turn out to be a much more limited correction than originally anticipated. The trick in trying to evaluate its extent is to determine which part of the top distribution pattern will give us the correct projection. Depending on which area we choose, it could be anywhere from a little over a hundred, to a three-hundred-point decline (and counting). The former is starting to look more and more likely, particularly considering the disjointed nature of the overall market, with only the major averages seemingly being coherent.
Unless! The smaller correction may only be the tip of the iceberg and that, after it is over, the next rally fails to make a new high but simply adds to what turns out to be a long-term distribution pattern. For now, I still believe that an eventual move to 2240 is possible, based on the accumulation which took place at the 1810 level. However, if the rally which follows the current correction fails to make a new high, and a new phase of weakness begins, I may have to change my opinion.
There are some, like Tony Caldaro, who believe that a new bull market has been under way since February 2016. Tony does not make snap judgments, but bases his opinion on historical precedents. However, for now all long-term forecast are pure speculation. The market reveals itself phase by phase and, with proper analysis, we do not have to be surprised by the next move. We are currently in a correction which, when complete, should be followed by an uptrend, the nature of which we will analyze when it takes place.
Analysis
Daily chart
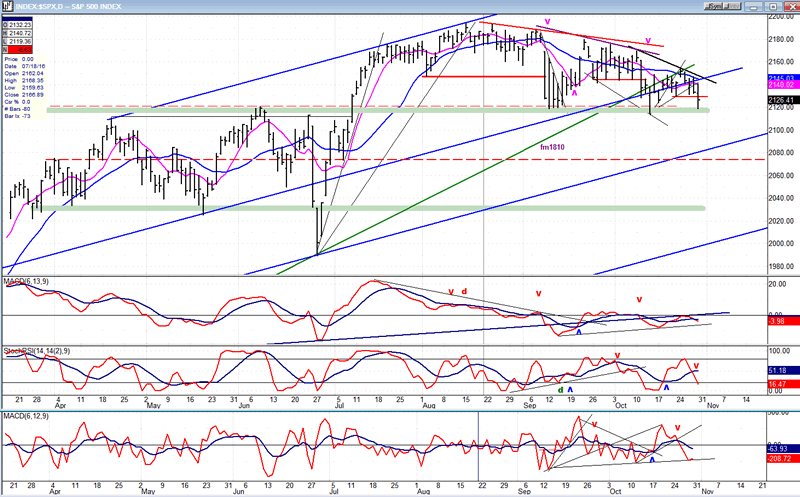
The perception that we are making a rounding top was supported by last week’s SPX action. We are now able to connect a declining top with three trend lines which are trending at a steeper and steeper angle. After the first decline from the top formation, we started a sideways move which is beginning to look more and more like triangle. If this is the case perhaps, after a little more weakness, we should get one more rally to the last declining trend line and, on the next move lower, we should convincingly break through the dashed line and, at a minimum, proceed to the vicinity of the blue parallel drawn across the Brexit low.
As of now, there is no technical evidence altering the view that the cycle is still bottoming with a presumed ETA late next month. We can also see that the 2115-2120 level has been a strong support area which has held prices for nearly two months. If the cycle continues to exert pressure for another three weeks, it’s unlikely that this level will hold and, when it gives way, we should get the rapid climactic move that is typical of this formation.
For now, at least, the oscillators are not disagreeing with my expected scenario. They gave a sell signal when they made a bearish cross of their slower MA.
This chart and others below, are courtesy of QCharts.com.
Hourly chart
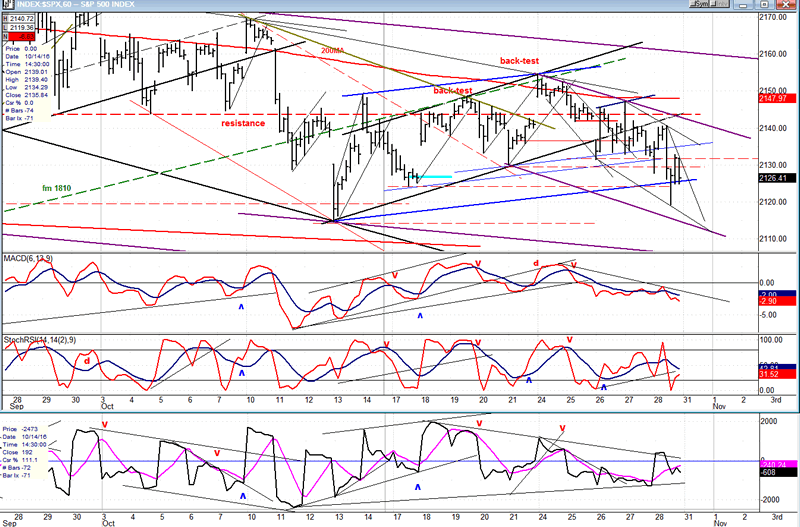
The hourly chart shows that price movement has progressed in down staircase fashion. The last minor up-channel back-tested the trend line from 1810 three times before the index started down. As suggested above, that decline may not be quite finished -- with another drop slightly below last week’s low.
That would complete the “d” wave of the triangle discussed – and more visible – on the daily chart. The next move would then go and challenge the top of the down-channel, and possibly move slightly above before completing the triangle formation. This would be followed by the decline into the cycle low.
The oscillators, especially the MACD, are still declining and are all below their moving averages. This suggests that the near-term decline is not over, especially since we closed below 2131 on Friday, a level which has held prices for the past month.
Some leading & confirming indexes (Weekly charts)
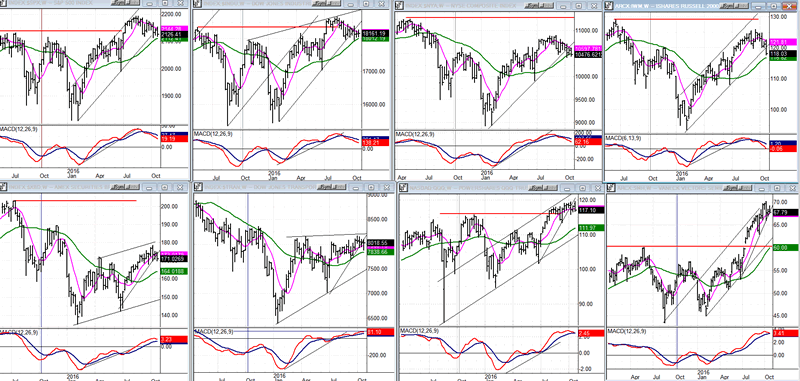
Last week’s selling is not all that noticeable at the weekly level for the indexes shown below. The one which was the most affected is IWM, which is one of the prime leading indicators. If you look closely, you will also see that the NYA was the worst performer of the main indexes. It is also the one which comprises the most equities. The rest simply stopped going up but do not show that much long-term distribution.
The overall picture is not one of a market which is under massive distribution and which is ready to start a serious decline. So far, it’s either a consolidation in an uptrend, or the beginning of a more extended period of distribution which will continue after the cycle currently pressing on the market has bottomed.
UUP (dollar ETF)
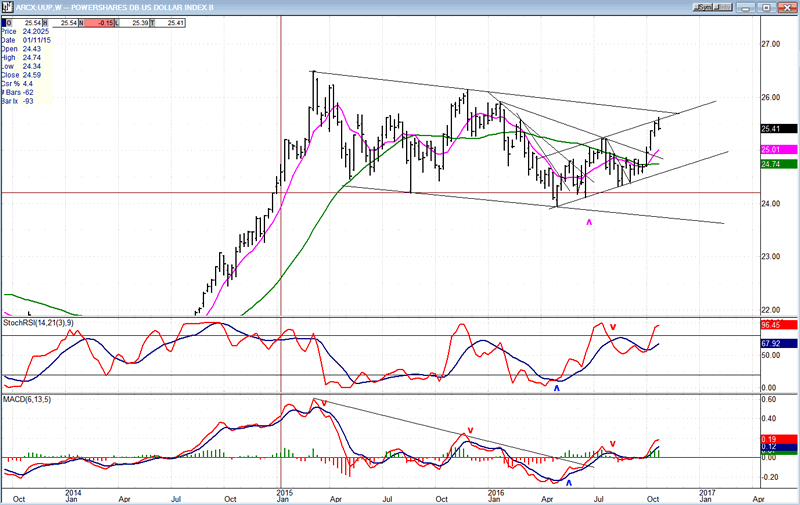
UUP has reached the top of its up-channel and pulled back, which is normal. The fact that prices reached the top of the channel, and even went a little beyond, suggests that there is no price deceleration, but that a normal overbought profit-taking process is underway. After some consolidation, the index is expected to challenge the current resistance level once again and perhaps even to rise out of the 18+-month corrective channel.
GDX (Gold Miners ETF)
After a long and deep correction from its July 2011 high, GDX started what could be a new significant uptrend which has now retraced 50%. The retracement corresponds with an important support line, and both factors contributed to a 3-wk bounce.
That bounce did not create a new uptrend, but appears to be only a consolidation. The position of the indicators strongly suggests that the correction is not over, and that a new low to the .618 level could materialize over the next couple of weeks. Should that happen, the index’s ability to transform its strong initial rally from the lows, into a major new uptrend will be judged on subsequent performance.
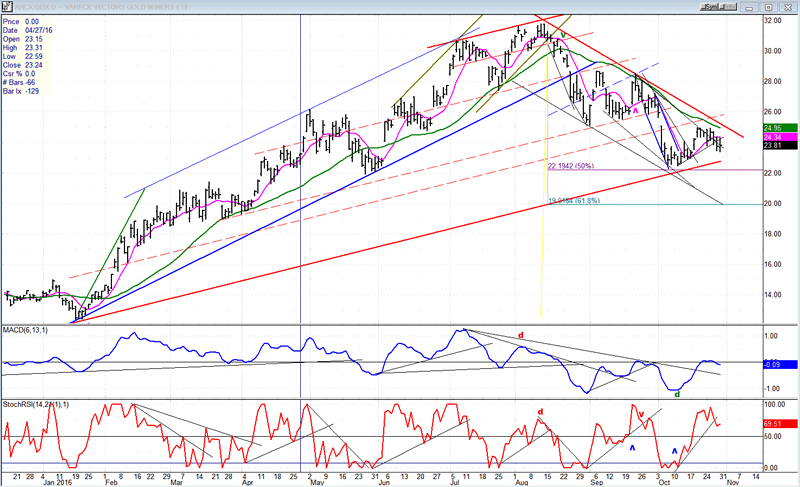
Note: GDX is now updated for subscribers several times throughout the day (along with SPX) on Marketurningpoints.com.
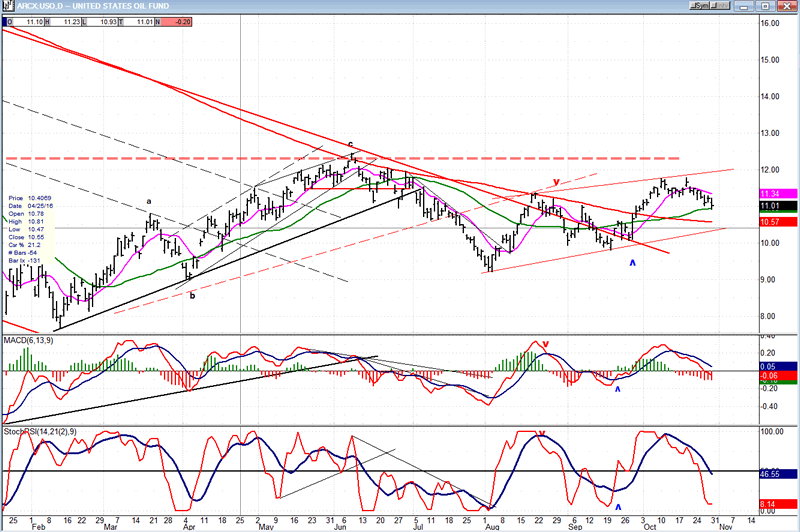
USO (U.S. Oil Fund)
After additional correction, USO could, once again, attempt to rise to the resistance level represented by the dashed line -- unless it declines below the 10 level first.
Summary
SPX continues its rounding top formation and may be in the process of forming a triangle consolidation which should be followed by a sharp drop into the cycle low.
The formation of a triangle pattern is only speculation at this point, and the pattern could easily evolve into something else, with the downward acceleration coming sooner. In either case, the correction continues to be a work in progress which is incomplete.
Andre
FREE TRIAL SUBSCRIPTION
If precision in market timing for all time framesis something that you find important, you should
Consider taking a trial subscription to my service. It is free, and you will have four weeks to evaluate its worth. It embodies many years of research with the eventual goal of understanding as perfectly as possible how the market functions. I believe that I have achieved this goal.
For a FREE 4-week trial, Send an email to: info@marketurningpoints.com
For further subscription options, payment plans, and for important general information, I encourage
you to visit my website at www.marketurningpoints.com. It contains summaries of my background, my
investment and trading strategies, and my unique method of intra-day communication with
subscribers. I have also started an archive of former newsletters so that you can not only evaluate past performance, but also be aware of the increasing accuracy of forecasts.
Disclaimer - The above comments about the financial markets are based purely on what I consider to be sound technical analysis principles uncompromised by fundamental considerations. They represent my own opinion and are not meant to be construed as trading or investment advice, but are offered as an analytical point of view which might be of interest to those who follow stock market cycles and technical analysis.
Andre Gratian Archive |
© 2005-2022 http://www.MarketOracle.co.uk - The Market Oracle is a FREE Daily Financial Markets Analysis & Forecasting online publication.