


India's Stock Market: Nothing "Random" About It
Stock-Markets / India Dec 09, 2016 - 07:59 PM GMTBy: EWI

 See how beautifully India's 8-year long bull market follows a clear Elliott wave fractal pattern
Every day, the mainstream financial experts attempt to explain away fluctuations in stock market trends with some "fundamental factor" du jour, all of which boil down to this: good news causes a market to rise and bad news -- to fall.
Problem is, sometimes the experts end up using the same "fundamental" to justify the market's upward AND downward moves. A Recent case in point, from South Asia:
"Sensex Down 324 Points as U.S. Picks Donald Trump as President."
VERSUS
"Sensex Makes Recovery Amid Donald Trump Win."
How can the same event -- the election of Donald Trump -- be bullish AND bearish for India's stock market? You might as well say that it moves at random, as most people do.
But before you join them -- consider that there may be something other than "fundamentals" driving trends.
In the words of Ralph Nelson Elliott, the discoverer of the Wave Principle:
"The wild, senseless, and apparently uncontrollable changes in prices from year to year, from month to month, or from day to day link themselves into a law abiding rhythmic pattern of waves...
"Current news and political developments are of only incidental importance, soon forgotten."
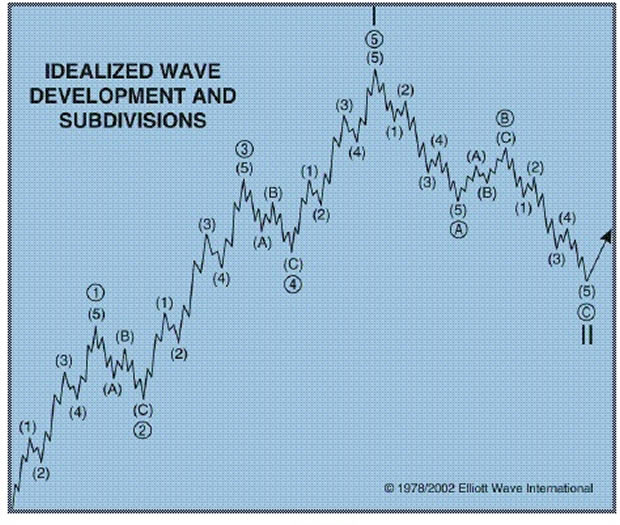
Elliott saw the fractal, a pattern that repeats in form but not in time or amplitude, as the overriding design of all stock market progress and regress. This diagram shows you the Elliott wave fractal's idealized development and subdivisions:
As for a real-world example of the Elliott wave fractal formation in stock markets, investors need only look at the last eight years in India's bellwether Sensex index.
From the beginning, in 2008, the Sensex was mired in a bearish slump, with the market circling the drain of a three-year low, having plummeted 50% from its December 2007 peak to below the 9000 level. But instead of focusing on the doom and gloom on Dalal Street (India's Wall Street), our analysts honed in on a telltale pattern unfolding directly on the Sensex's price chart.
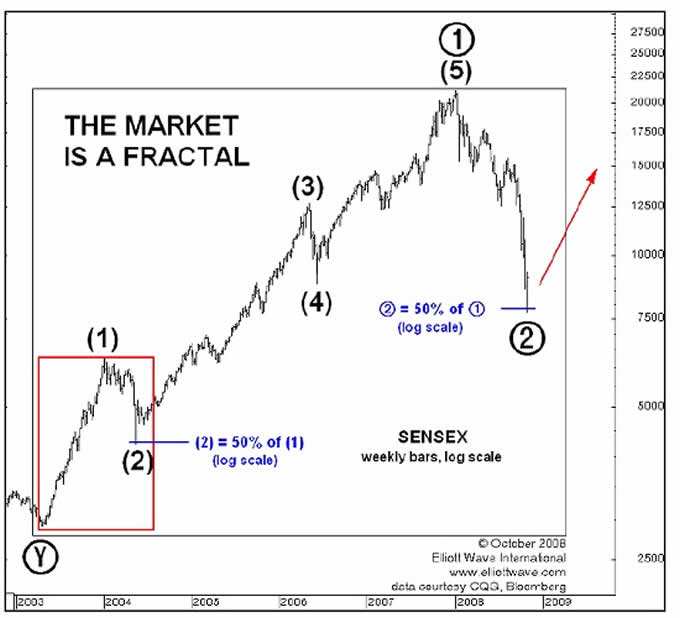
Here, our November 2008 Asian-Pacific Financial Forecast featured a special section on India and wrote:
"The Wave Principle teaches that the stock market is a self-similar fractal. That means that some pieces of its price record -- which Ralph Nelson Elliott called waves -- resemble other pieces elsewhere in that record. The weekly chart of India's Sensex shows just such an example.
"Notice how the up-down sequence labeled Intermediate waves (1) and (2) (in the small red box) is a microcosm of the larger up-down sequence from the 2003 low to the present (i.e., waves 1 and 2, in the large black box). In both cases, the wave-two correction retraced approximately 50% of the wave-one advance.
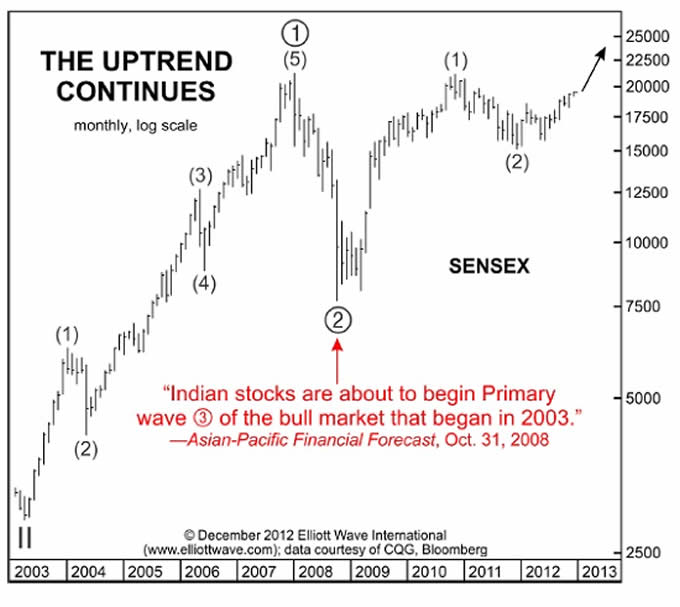
"If we have identified this 'nested fractal' relationship correctly, it means that Indian stocks are about to begin Primary wave 3 of the bull market that began in 2003."
From the point of that 2008 forecast, the Sensex more than doubled in value before hitting the breaks and turning sideways in early 2011. After a year, the December 2012 Asian-Pacific Finanical Forecast said the uptrend was about to resume:
"Conventional observers may say that the social malaise and political gridlock at present make a bull market in India unlikely. Elliotticians and socionomists, however, know that those conditions are merely lagging results of the corrective period of the past two years. They are also precisely the kind of conditions in which major advances begin. In fact, as Indian stocks now advance in wave (3) of 3 of III, India's future looks brighter than ever.
Indeed, from there, the Sensex took off like a rocket in its most powerful bull-market phase ever, soaring to an all-time record high above 29,500 on March 3, 2015.
India's 8-year long bull market isn't an exception to the mainstream "random" walk model. It's the rule for all liquid financial markets across the globe, where collective investor psychology creates trends big and small -- regardless of news and events.
Learn Why the Elliott Wave Principle WorksWatch the Elliott Wave Crash Course. Stop reacting to news and fundamentals events. This free, 3-part video series provides a solid basis for why you should use Elliott analysis for your trading and investing decisions. |
This article was syndicated by Elliott Wave International and was originally published under the headline India's Stock Market: Nothing "Random" About It. EWI is the world's largest market forecasting firm. Its staff of full-time analysts led by Chartered Market Technician Robert Prechter provides 24-hour-a-day market analysis to institutional and private investors around the world.
© 2005-2022 http://www.MarketOracle.co.uk - The Market Oracle is a FREE Daily Financial Markets Analysis & Forecasting online publication.