


Massive VIX Stock Market Warning for all Traders
Stock-Markets / Stock Markets 2016 Jan 12, 2017 - 03:52 PM GMTBy: Chris_Vermeulen

 My analysis of the recent VIX action is clearly warning of a potentially massive price volatility increase in the US and global markets. Many traders use and trade the VIX as a measurement of volatility. The VIX is a measurement of the expected market volatility over the next 30 days. As the VIX rises, traders expect larger and more volatile price swings. As the VIX declines, traders expect smaller and more narrow price swings.
Currently, the VIX is near historical low levels and has recently past a critical cycle midpoint.
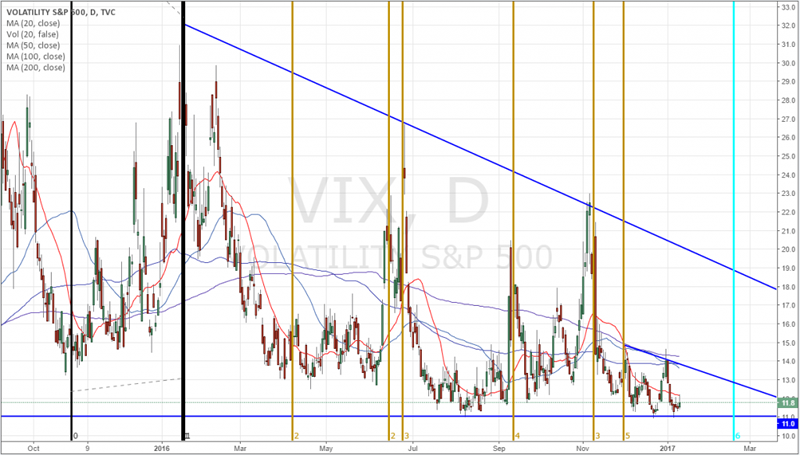
One can see from my cycle analysis, I am tracking to cycle events; a longer term top-to-top cycle event and a smaller bottom-to-top cycle event. I call these dual-phase and single-phase cycle events, respectively.
This analysis tells me we recently past a single-phase bottom cycle (near Nov 30th) and are expecting a dual-phase top cycle event near Feb 17th. Given the expected opportunity to retest the VIX high channel, the potential price move in the SSO would relate to a 11%~16.5% price swing (approx) – or larger. The dark blue downward VIX channel is a boundary that we would expect the VIX move to attempt to reach. It could blow past this level and develop a much larger price correction in the US and Global markets but lets just focus on one target at a time for now.
Now, let’s take a look as how this relates on the SSO chart.
On the below SSO chart, I have highlighted the critical VIX “Peak” levels with rectangles and I have drawn the VIX Single and Dual phase event cycles. You can clearly see how these event cycles align with critical price swings and, most recently (after the US election cycle) correlated with a cycle event low and high.
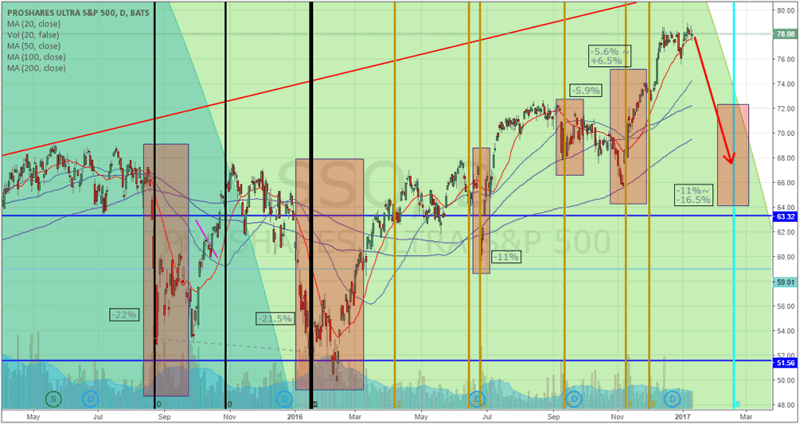
On the hard-right edge of the chart, I have drawn what I believe will be the likely VIX cycle event target range and target date range. I expect the VIX to increase moderately over in the next week or so and explode as stock prices rotate lower. I expect the US and global markets to react to these time cycles and for an increase in volatility. The chart shows a sharp correction as that is the max potential, but we could only see a 2-5 day dip before it heads higher. Either way volatility should jump soon and I plan to get involved with an ETF.
Our last few ETF trades generated some big profits with EDZ 20.7%, NUGT 11%, and UGAZ 74% return. I feel the VIX is starting to show signs of an opportunity unfolding.
Join www.ActiveTradingPartners.com to stay up to date with my analysis and learn how to take advantage of my weekly stock picks and market forecasts as we gear up for another incredible year of trading!
John Winston
Chief Investment Stratgist
Chris Vermeulen
Chris Vermeulen is Founder of the popular trading site TheGoldAndOilGuy.com. There he shares his highly successful, low-risk trading method. For 7 years Chris has been a leader in teaching others to skillfully trade in gold, oil, and silver in both bull and bear markets. Subscribers to his service depend on Chris' uniquely consistent investment opportunities that carry exceptionally low risk and high return.
Disclaimer: Nothing in this report should be construed as a solicitation to buy or sell any securities mentioned. Technical Traders Ltd., its owners and the author of this report are not registered broker-dealers or financial advisors. Before investing in any securities, you should consult with your financial advisor and a registered broker-dealer. Never make an investment based solely on what you read in an online or printed report, including this report, especially if the investment involves a small, thinly-traded company that isn’t well known. Technical Traders Ltd. and the author of this report has been paid by Cardiff Energy Corp. In addition, the author owns shares of Cardiff Energy Corp. and would also benefit from volume and price appreciation of its stock. The information provided here within should not be construed as a financial analysis but rather as an advertisement. The author’s views and opinions regarding the companies featured in reports are his own views and are based on information that he has researched independently and has received, which the author assumes to be reliable. Technical Traders Ltd. and the author of this report do not guarantee the accuracy, completeness, or usefulness of any content of this report, nor its fitness for any particular purpose. Lastly, the author does not guarantee that any of the companies mentioned in the reports will perform as expected, and any comparisons made to other companies may not be valid or come into effect.
Chris Vermeulen Archive |
© 2005-2022 http://www.MarketOracle.co.uk - The Market Oracle is a FREE Daily Financial Markets Analysis & Forecasting online publication.