


Using Macroeconomics to Obtain Long-term Market Forecasts
Stock-Markets / Financial Markets Aug 09, 2008 - 03:31 AM GMTBy: Mike_Stathis

 As I mentioned in the previous 3-part series on market forecasting, we must look at several variables in order to get a good sense of where the market might be headed. In that series of articles, I discussed sentiment, charting and methods of market valuation. I have integrated some of this previous material with new material here. You can find the other material elsewhere online. Here, I discuss the charting section and extend the discussion to long-term market forecasts.
Short-term Forecast (first published on July 18, 2008 )
As you recall, the Dow made an all-time high in October 2007. Since then, it has made lower lows and lower highs, typical of a downward trend. But how far and how long will this bear market last? First of all, we need to remember that the previous bullish rally was quite fast, with the lion's share occurring over 6 months (May to October 2007) for around 18% gains. What does that mean? Well, in my opinion, it means the bullish rally was not that valid. Remember, price validity strengthens with time.
If we look where the Dow is now, it's easy to see that it hit some strong support around the 10,800 range. However, this support was just prior to the previous Bull Run which began in early 2007. In other words, if in fact, the previous Bull Run was somewhat of an artifact, it is likely that the Dow has a way to go down before any long-term trend reversal.
Next we examine a 14-month chart of the Dow. As you can see, I've drawn the upper and lower trend lines. The dashed lower trend line illustrates very short-term extreme selling pressure (intraday) I typically dismiss as noise. But as you can see, we've encountered three of these periods thus far (the large intraday sell-offs that rebounded strong at the close) making what I would normally consider to be noise an important consideration.
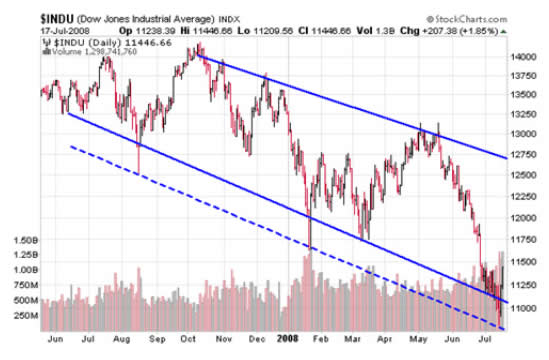
The question everyone is asking is where the market will head over the next several months. No one knows for certain, as this depends upon many variables and the timing of these variables. All we can do is look at the possibilities. The first thing I will say is that, based upon the three previous periods of extreme selling pressure (intraday), it is likely that we will see additional periods of these brisk sell-offs, but only if the longer-term downward trend remains in place, which appears likely. These short, intense sell-offs, although intraday, strengthen the magnitude of the downward trend.
The Dow is currently trying to mount a strong rally up from the previous oversold level of around 10,800. Notice the high volume coming in to support the bottom trend line during the most recent market activity. This rally was triggered by the Fed's bailout commitment to Fannie and Freddie, as well as what has been interpreted as additional positive news in the financial sector. Thus, the market is once again looking for excuses to rally and is interpreting what I would view as bad news to be good news. If this sentiment continues, barring any further catastrophic events over the next several weeks, it looks as if the market could continue the current rally. But by how much and for how long? Assuming nothing major happens, it is entirely possible this rally could extend up to the 12,300 to 12,500 range over the next few months, perhaps sooner. As you can see from the upper trend line, the longer this rally stalls, the less it will ascend. As an example, if the market mounted a spectacular rally over the next two days, it might rise as high as the 12,700 level before meeting resistance.
Even if the current rally continues, that does not mean we won't retest recent lows before making it all the way up. In contrast, if over the next few weeks, the market drops below recent lows, it could signal some really big problems since there is very little support until the 10,100 range. As the next chart shows, a breakdown below 10,000 would be catastrophic, as there is very little support down to the 8300 range. The good news is that the 10,600-10,800 support level is fairly strong and the 8300 level is stronger. The bad news is that, in my opinion, many more problems will surface down the road, not only with the financials, but with corporations, hedge funds, and consumers. It is likely we will see over 200 bank failures, a huge corporate junk bond market (to match that seen in the MBS market), and maybe even a meltdown of the derivative market, specifically the credit default swaps.
Understand that even if the market continues the rally from here, it is still in a longer-term downward trend with no real bottom in sight. Therefore, without significant evidence of a longer-term trend reversal (i.e. one or more strong rallies above the upper resistance trend line that hold above these levels over an extended period), investors would be wise to trim positions once the rally tops out (which could be in the 12,300-12,500 range) and wait for a sell-off to lower lows. As the angle between the upper and lower trend lines widens, you should expect to see even more market volatility down the road, most of it on the declining side.
Long-term Forecast
Here, I want to extend the process of market forecasting to include macroeconomics, followed by an overall risk analysis. This will help us get a better handle on longer-term market forecasts.
As I've emphasized in the past, there are certain things you must have if you want a truly strong economy. Most important, you must have a strong dollar, inexpensive oil and commodities. It is of no coincidence these three things are directly related to each other. When you have a weak dollar, it will ultimately lead to high oil and commodity prices. Eventually, this will lead to high inflation, which tends to cause the Fed to raise interest rates – that is, if the Fed's goal is to protect consumers. Rather than the cause, a weak dollar serves as the result of a weak economy; an economy that has been propped up on excess consumption resulting in an enormous debt burden – an economy that exports jobs and wealth while importing manufactured goods and credit. You cannot have a strong economy if just one of these is present:
- Weak Dollar
- Expensive Commodities
- Expensive Oil
- High Inflation
- Unmanageable Debt
As you know, America shares all five of these characteristics. Of more concern, each is getting further out of control. Why is it so difficult for so many perma-bull pundits to accept these basic economic principals? Now let's take a look at America 's past to see how well these variables have played out. Note the results in the tables that follow may vary based not only on the source of data but also on how I have interpreted this data.
| 1920-1929 | 1930-1949 | 1950-1959 | 1960-1969 | 1970-1979 | |
| Dollar | Strong | Weak>Better | Strong>V. Strong | Moderate | Mod>Expensive |
| Commodities | Cheap>expensive | Expensive | Cheap | Expensive | Expensive |
| Oil | Inexpensive | Inexpensive | Inexpensive | Inexpensive | Expensive |
| Inflation | Low/Deflationary | Deflation>Inflation | Normal | Normal | V. High |
| Interest Rates | Low | High | Low | Modest | V. High |
| Debt | V. Low | Rising>High | High>Modest | Modest>Rising | Modest |
| Gold | Low | Increasing | Decreasing | Low | Increasing>High |
| War | No | WWII | Korean War | Vietnam War | Vietnam War |
| Special | Stock Bubble | Depression | America 's Golden Period | Cuban Missile Crisis | US Becomes Debtor |
| Special | Real Estate Bubble | New Deal | Dollar becomes universal currency | Kennedy Assassinated | Peak Oil in America |
| Special | Bull market>1929 Crash | Gold recalled from consumers | Official end of Bretton Woods | ||
| Special | OPEC accepts only dollar for oil | ||||
| Stock Market Performance | 12.5% annually | -1.1% annually | 17.3% annually | 1.9% annually | 1.1% annualized |
Copyright © 2008. All Rights Reserved. Mike Stathis, Apex Venture Advisors.
With little surprise, what I first wrote in 2006 still stands today …..“With household savings rates at all-time lows, consumer debt at all-time highs, record Federal debt and trade deficits, no real job or wage growth, a prolonged military conflict in Iraq, a weak dollar, record energy prices, a real estate bubble ready to burst (imploding as we speak), increasing inflation, a record number of underfunded pensions, increasing dependency on Social Security, and a healthcare crisis that keeps getting worse, how can anyone claim that the U.S. economy is improving? Are you kidding?”
“During strong economic recoveries tax revenues are high, normally accounting for a large portion of the GDP. But during the current “recovery” we have seen the opposite . Finally, economic recoveries are the result of net job and real wage growth, as well as an increase in savings rates, none of which have occurred.”
| 1980-1989 | 1990-1999 | 2000-2003 | 2004-2008 (July) | 2009-2014 (estimate) | |
| Dollar | Weak>Strong>Mod | Mod >V. Strong | Strong>Declining | V. Weak>Declining | Low>decreasing |
| Commodities | High, decreasing | Low | High, increasing | V. High, increasing | High>Decreasing |
| Oil | V. Expensive>decl | Moderate | Mod, increasing | High>V.V. High | High>Increasing |
| Inflation | V. High, decreasing | Normal, decreasing* | Normal/Deflationary* | High>Rising* | High>Increasing |
| Interest Rates | V. High | Modest | Modest>V. Low | Low | Low>High |
| Debt | High>Rising | High>Decreasing | High>Increasing | V. High>Increasing | V. High>Increasing |
| Gold | High>Decr>Increasing | Decreasing | Increasing | High>V.High | High>Increasing |
| War | Cold War | Persian Gulf War | Invasion of Iraq | Invasion of Iraq | Continued Occupation |
| Special | USPTO established | NAFTA, WTO, Great Bull Market, Internet | China enters WTO | Fed bails out big banks | Auto, airline bailouts 100s of bank failures |
| Special | Collapse of Berlin | European Union | Euro is official | Fed bails out Fannie and Freddie, FASB | |
| Special | Gold peaks and crashes | Collapse of USSR , Asian Financial Crisis | Bear Stearns given to JP Morgan | ||
| Stock Market Performance | 20.6% annually | 23.3% annually | 1.1% annually (Payback time) | 2.1% annually (Payback time) | Payback time |
*In 1994, Washington changed critical aspects in the way that it calculated inflation. Since then, changes have been made each year. As a result, inflation data since 2000 has been estimated to have been understated by the author.
Copyright © 2008. All Rights Reserved. Mike Stathis, Apex Venture Advisors.
What About Oil?
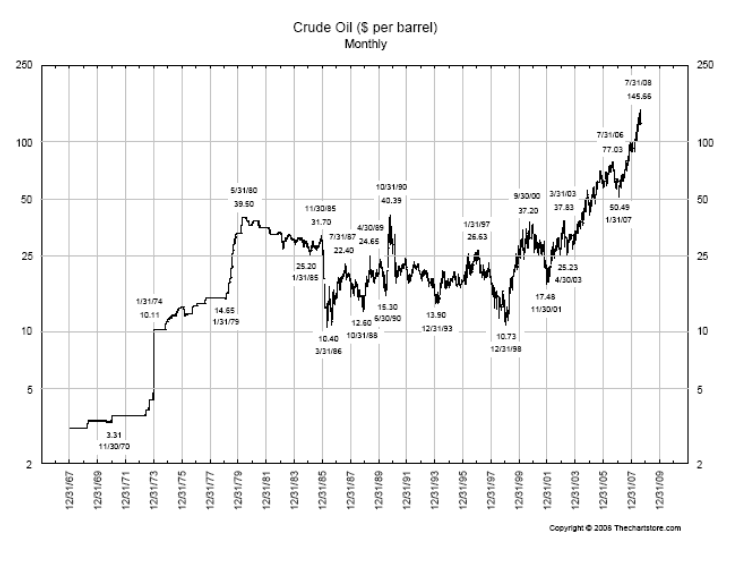
So how far will oil correct? In a previous article, I mentioned the possibility for a 30% to 40% correction in oil when it was around $140 (see “Using Oil to Beat Inflation”). Thus far, my forecasts have not changed except I am now leaning towards the high end of this estimate, placing the correction to around $100. At least in America 's case, that is really the one trillion dollar question. Could oil correct down to $80? Yes. But I would not expect to stay there for long. Let me give you a run down of the probabilities of support areas for oil over the next 10 months based upon technicals alone. These estimates are subject to change based upon many factors, the least of which includes oil price movements.
Price |
Probability |
$105 |
95% |
$100 |
90% |
$95 |
85% |
$90 |
70% |
$85 |
50% |
$80 |
30% |
$70 |
10% |
But remember this is just a short-term trend. As you can see from the chart, the long term trend remains strongly intact. Therefore, this correction will present a buying opportunity in the near future. Consequently, it is due to these huge swings in volatility that I recommend non-active traders to consider investing in oil trusts since they deliver nice double-digit dividends.
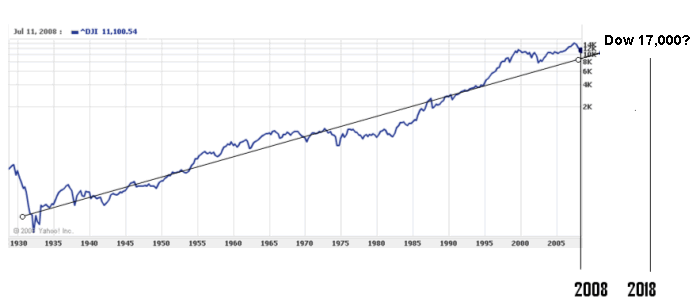
Okay, now that we've considered the macroeconomic forces that certainly don't bode well for the economy I want to take a look at the market. In the chart below I have drawn a best-fit line through the DJIA. As you can see, that places the fair value just below 9000. Now, I'm not saying the Dow will fall to 9000, but it is certainly possible. However it is likely that the DJIA will obey this trend over the long-term. That could mean a drop to 9000 soon, or a sideways movement for many years until the slope brings it up higher. The longer the drop is avoided the lower it will be (due to the upward slope). The sooner a full market correction occurs, the sooner we can gear up for a more bullish pattern.
Charting
Previously I wrote a piece on market forecasting (Market forecasting Tutorial: Market Valuation) where I pointed out that the PE ratio of the Dow had approached a near critical level of around 10 or so (originally published July 18, 2008 ).
As you can see from the table, the PE ratio for the Dow hit 14 in June. After the sell-off in July 2008, it most likely fell by another point or so. Now I want you to look at the projected PE. This is the PE based on consensus earnings forecasts. It's the one we should always focus on, whether we are looking at an individual stock or the entire market. However, trailing PE ratios do tell us what the market will bear, so they factor into sentiment. Projected PE ratios are what investors partially base their buy and sell decisions on. And if earnings estimates are wrong, prices get crushed. So now we ask whether analysts have discounted the effects of the economy adequately or even aggressively. If you can answer that, you will know where the market is headed over the next few quarters.
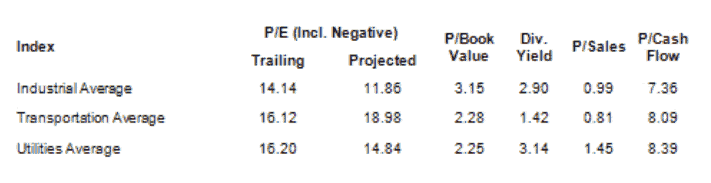
I want to emphasize this PE ratio data is critical because there is little doubt that July market lows moved the future PE ratio very close the single digit territory. This is critical is because every bubble washout I have studied has only shown a recovery once the PE has either hit the low teens or single digits. Ever since the dotcom meltdown, the PE ratio has not fallen to the low teens until now. I cannot overemphasize the importance of this because it has significant implications for a trend reversal. I discuss this in more detail and its implications in my book, “ America's Financial Apocalypse .”
So for those of you who seem to think I am a perma bear, this is just one example that proves I am not such a beast, since the DJIA PE ratio has very bullish implications. In contrast, while the market PE is very impressive, I feel there is much more carnage down the road, as I have previously mentioned. The effects of the real estate and banking meltdown will spill over into the entire economy. We will soon see the broader effects of the banking collapse which has been cushioned by the endless printing of the dollar, record oil prices, and what I expect to be a global recession.
No one knows whether this worst case scenario will play out but if you are on the look out, you will spot further problems in advance and this will give you an edge over other investors. So what am I saying? The message is that you cannot use market valuation techniques for market timing. But you can use valuation to help with other indicators when trying to determine the timing. Timing is better estimated by understanding the full risks to the economy and stock market. And when news is first reported, those who have factored in these risks will more readily understand the full impact in advance, while others cling onto hope and misguided optimism.
It is very possible DJIA/S&P earnings will not reach consensus estimates, as discussed previous (“Here Comes the Earnings Meltdown”). If so, that alone will lower the PE. And combined with a further drop in the Dow, it would clearly send it into the single-digit territory. This would provide significant evidence of a bottom. But we must also accept the fact that there is much house to clean in the economy, and this will take quite a bit of time. Still, this single-digit PE ratio, if reached is something we need to keep an eye on because it will have signaled the beginning of a washout phase. Now, this bottom, once reached, could linger for quite a long time. For estimates on timing of a trend reversal, I would focus on sentiment – responses from the market upon news events, put-call ratios, money flow, and VIX.
While this may have been enough for a long-term reversal of the bearish trend, given all that I expect from the economy, I would bet the market has not yet made its lows. If that turns out to be the case, we might approach the 9000 range. And if we do, you should get ready to buy with full force because that would definitely place the PE in single digits – a clear sign of a complete market washout.
Although it's a rough estimate, the best-fit line I've drawn from 2008 to 2018 seems to be reasonable. That would place the Dow around 17,000 by 2018 – not such a good performance unless you are just now starting to invest. Also note that I've been conservative in drawing the price performance from 2008 to 2018. I selected these estimates because I did not want to scare you. In all fairness to the counterpoint, you can figure that the possible inaccuracy in this slope might put the slope at 17,000 let's say by 2015 but that's still not impressive.
It stands to reason that the DJIA could dip substantially below the trend line to compensate for the time it spent above the line. Finally, note as well that there could be large price spikes but they will most likely not hold for long. While no one knows what will happen, you should consider these scenarios along with the Dow 30,000 predictions made a few years ago if you want a balanced assessment. Make no mistake, I am by no means a perma-bear. I consider myself a realistic, reporting only what I see.
What Do We Have to Look Forward to?
As a final note, consider the 80 million baby boomers that were just beginning to recover from the $7 trillion of losses from Internet bubble. And now they're faced with the current meltdown which has already erased $2 to $3 trillion from the stock market and $6 trillion from home values. Throw in $500 billion in bank write downs, over $1 trillion in Fed bailouts to the banking cartel and things aren't looking so great. But when we consider the likelihood of another $500 to $700 billion in write downs, another $1 to $1.5 trillion in banking bailouts, another $2 trillion losses in real estate value, things begin to look very ugly.
Oh, and did I mention hundreds of potential bank failures, corporate bankruptcies, millions of job losses, an auto and airline industry bailout? The grand finale could be the implosion of the $65 trillion (nominal value) of the CDS market. That alone introduces an entirely different scenario which does not bode well for anyone anywhere in the world. In America , things begin to look even worse when you add the expected $51 to $72 trillion deficit for the boomer's entitlement programs. At the very best of scenarios, America will linger for many years in my opinion. And if a catastrophic event occurs like a CDS meltdown, the global economy could witness an unprecedented meltdown unlike anything ever imagined.
Too Little, Too Late
Washington continues its reactionary damage control. They haven't been preemptive at all because they really don't understand the full extent of the problems. But apparently there have been some wakeup calls. The SEC extended its ban on naked shorting for its select group of banking buddies. Mysteriously, the banks that need protection from naked shorting the most (WM, WB, ETFC – with short interest ratios of 13 to 29%, as well as distressed financials) are absent from this list.
The FASB recently put the accounting rule on hold that would force banks to consolidate up to $5 trillion off-balance assets onto their books. Citigroup alone has $1.1 trillion of these assets. The rule is expected to go back into effect by November 2009. What is the rationale? Do they really think things will get much better in a year? Good luck. On the other hand, if this rule had not been delayed, it would have forced banks to embark upon an unprecedented capital-raising effort. And banks are scrambling to provide more transparency and regulation to the CDS market. As it stands currently, the institutions that hold CDS are essentially unregulated. What that means is that they have no requirements to maintain any level of capital reserves. Can you say Fannie and Freddie times 10? I don't know about you but even I'm getting very concerned.
Recessions Are Good!
The market isn't going to rebound all by itself. If it does it certainly won't last. We saw the surge in 2007 last only a short time once reality set in. Similar to recessions, market corrections clean the system of sewage, enabling it restart a period of positive gains. As long as the Fed continues to try to mitigate what must naturally occur – a complete recession - we will be treading water, setting the stage for a much bigger crisis down the road.
In order for a sustained bull market to emerge we first need to clear out the trash in the economy, and that means we need a full recession. Only then can we start anew towards rebuilding a strong economy – a strong dollar, reasonable oil and commodity prices, good jobs, healthy savings and investment, and manageable debt. But this is easier said than done. Major policy changes will be needed for a permanent recovery – restructuring free trade policies, a solution to the healthcare crisis, and a fix for America 's free market system. Until then, you can bet the Fed will continue the boom-bust cycles it's becoming known for.
Mike Stathis is the ONLY investment expert who has no vested interests in his insights. Unlike others, he does not sell gold or promote gold vendors to benefit in some way. Finally, he is NOT a perma bear.
If you want to read what the future holds, and how to profit from this mess – all in unprecedented detail – get your hands on the most insightful book written on the coming depression - America's Financial Apocalypse ASAP.
By Mike Stathis
http://www.apexvc.com
Copyright © 2008. All Rights Reserved. Mike Stathis.
Mike Stathis is the Managing Principal of Apex Venture Advisors , a business and investment intelligence firm serving the needs of venture firms, corporations and hedge funds on a variety of projects. Mike's work in the private markets includes valuation analysis, deal structuring, and business strategy. In the public markets he has assisted hedge funds with investment strategy, valuation analysis, market forecasting, risk management, and distressed securities analysis. Prior to Apex Advisors, Mike worked at UBS and Bear Stearns, focusing on asset management and merchant banking.
The accuracy of his predictions and insights detailed in the 2006 release of America's Financial Apocalypse and Cashing in on the Real Estate Bubble have positioned him as one of America's most insightful and creative financial minds. These books serve as proof that he remains well ahead of the curve, as he continues to position his clients with a unique competitive advantage. His first book, The Startup Company Bible for Entrepreneurs has become required reading for high-tech entrepreneurs, and is used in several business schools as a required text for completion of the MBA program.
Restrictions Against Reproduction: No part of this publication may be reproduced, stored in a retrieval system, or transmitted in any form or by any means, electronic, mechanical, photocopying, recording, scanning, or otherwise, except as permitted under Section 107 or 108 of the 1976 United States Copyright Act, without the prior written permission of the copyright owner and the Publisher. These articles and commentaries cannot be reposted or used in any publications for which there is any revenue generated directly or indirectly. These articles cannot be used to enhance the viewer appeal of any website, including any ad revenue on the website, other than those sites for which specific written permission has been granted. Any such violations are unlawful and violators will be prosecuted in accordance with these laws.
Requests to the Publisher for permission or further information should be sent to info@apexva.com
Books Published
America's Financial Apocalypse: How to Profit from the Next Great Depression . Condensed Ed. Copyright © 2007.
Cashing in on the Real Estate Bubble . Copyright © 2006.
America's Financial Apocalypse: How to Profit from the Next Great Depression . Copyright © 2006.
The Startup Company Bible for Entrepreneurs: The Complete Guide to Building Successful Companies and Raising Venture Capital . Copyright © 2004 and 2005.
Disclaimer: The above is a matter of opinion provided for general information purposes only and is not intended as investment advice. Information and analysis above are derived from sources and utilising methods believed to be reliable, but we cannot accept responsibility for any trading losses you may incur as a result of this analysis. Individuals should consult with their personal financial advisors before engaging in any trading activities.
Mike Stathis Archive |
© 2005-2022 http://www.MarketOracle.co.uk - The Market Oracle is a FREE Daily Financial Markets Analysis & Forecasting online publication.