Gold Bull Market? Or was 2016 Just a Gold Bug Mirage?
Commodities / Gold and Silver 2017 Feb 15, 2017 - 02:03 PM GMTBy: Plunger
 The consensus view in the precious metals sector is that we have embarked on the next great bull market in gold and silver. The story is gold and the entire mining sector bottomed in early 2016 and launched into its first leg up into early August. The sector then underwent a stiff correction from August to December, and has now finally found its legs and the upward advance has resumed. Money is now flowing into exploration and development plays reflecting the belief in this narrative.
I have an alternative interpretation of the markets action and I would like to share it with you. Intellectual integrity requires me to remain objective and skeptical of the market action since Jan 2016 due to various reasons we will discuss. As an investor I participated in last year’s colossal rally from start to finish, however I am NOT convinced the epic gold bear market which began in 2011 ended in early 2016.
Last year’s rally may have been simply a B wave of an A-B-C correction within the massive bear market that started in 2011. The market uses such moves to relieve internal pressure and to reset psychology. Mr. Market is a deceitful devil and he does not consider us his friend, and uses fakery and tricks to divert us off the trail of success. He employs two diabolical lieutenants to do his dirty work, they are named Mr. Bull and Mr. Bear. Mr. Bear, particularly is a deceitful operator, as he drags market participates down the slope of hope using psychological warfare as his principle tool. Savvy operators who may recognize the trend is still down may attempt to profit by short selling, but Mr. Bear heads them off by squeezing them out of their positions just before the collapse occurs. Mr. Market’s objective is to travel alone to his destination, in so doing he denies you profit in his work. As I said, he is not a nice guy.
If Mr. Market’s ultimate goal is to bring gold and PM stocks to lower levels he needed to pursue different tactics by the fall of 2015. After a 4 year vicious bear market psychology had become universally bearish. Investors were bombed out, there were no more sellers, and for a market to go down it needs sellers. This is where Mr. Market deploys Mr. Bull to reset the psychology of the market. Mr. Bull introduces his tool of the bear market rally (BMR) which draws fresh money back into the market in hope that the bottom is in. Investors acquire a new sense of optimism and lean into the new (false) trend. What this does is refuel the market with new selling power and once the downtrend resumes this new supply powers the market below previous levels. Mr. Bull and Mr. Bear are dutiful soldiers executing Mr. Markets commands achieving his objectives. After a prolonged 4-year bear market, where everyone is universally bearish this process requires more than just a run of the mill BMR, it requires an A-B-C cyclical correction. The question is was the rally of 2016 just the B (up) wave of an A-B-C correction with C ( down) wave to follow.
The Big Picture- the alternative view
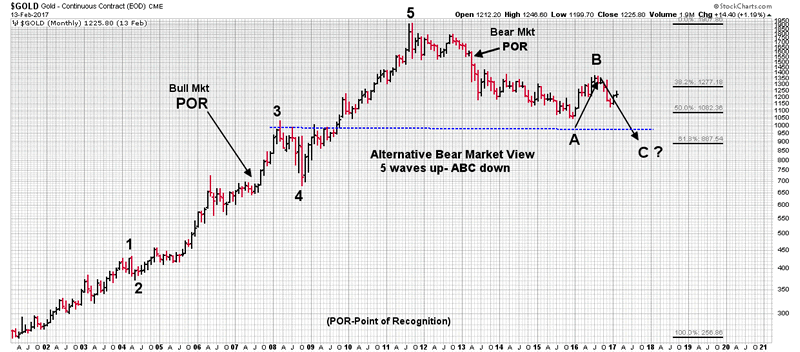
Let’s look at this big picture and explore whether the massive bear market which began in Sept 2011 could actually still be ongoing, which is my alternative view. I don’t really know if the bear ended in 2016, but until gold and the mining stock indexes can exceed the August 2016 highs we must consider , as a possibility , that it has not. The bull market from 2001 to 2011 traced out a 5-wave Elliot bull market pattern. Could the rally of last year just be a B wave of an A-B-C correction within the bear market which started in 2011? I am not convinced either way but I am keeping an open mind. The markers we watch are the lows and highs of 2016. When either of these are exceeded, we will then know the answer.
The Matterhorn
Mr. Market’s diabolical nature often results in him leaving us clues as he travels to his destination. It’s our job to uncover them and determine their meaning. My Matterhorn chart is instructive as it reveals clues while gold attempted to exceed its previous $1309 high of Jan 2015. My interpretation of this attempt is a wonderful example of how Mr. Market uses both of his his Lieutenants to deceive and build false hope among investors. It’s a case of extraordinary deception as he uses classical technical patterns. Here we can see a massive Cup & Handle just under the $1309 breakout level. The Brexit vote then provides the catalyst and breakout volume to drive home the bullish case. Who couldn’t be bullish at this point! But then this rally does what BMRs do… it peters out. This can be seen in the waning money flow and decaying RSI momentum, these are clues Mr. Market left along the way. Price is not able to sustain above the $1309 breakout level and finally gives it up. It’s a clear signal to sell, but the wile lieutenant, Mr. Bear has a trick up his sleeve. Mr. Market has tasked him to drag his victims down the slope of hope so they can deliver the selling fuel down at lower levels where he really needs it if he is to drive the market lower. So when the $1309 level is violated he keeps them in the market using his backtest tool. The price action we see from early October until November 8th, election night is a classic backtest of the $1309 breakout level. This recovering price action serves to keep investors in the market since it inspires hope. In addition, just in case some market operators don’t buy it and go short, expecting a continued decline Mr. Market delivers the coup d’grace, by running the short sellers stops on election night. You can see the squeeze and price volume spike on the chart below. So Mr. Market always gets what he wants, he dragged down and crushed the naive suckers who remained steadfastly bullish and he cleaned out the more sophisticated short sellers, by running their stops intraday just before the collapse. If you don’t think Mr. Market is a demented fellow, you are not paying attention.
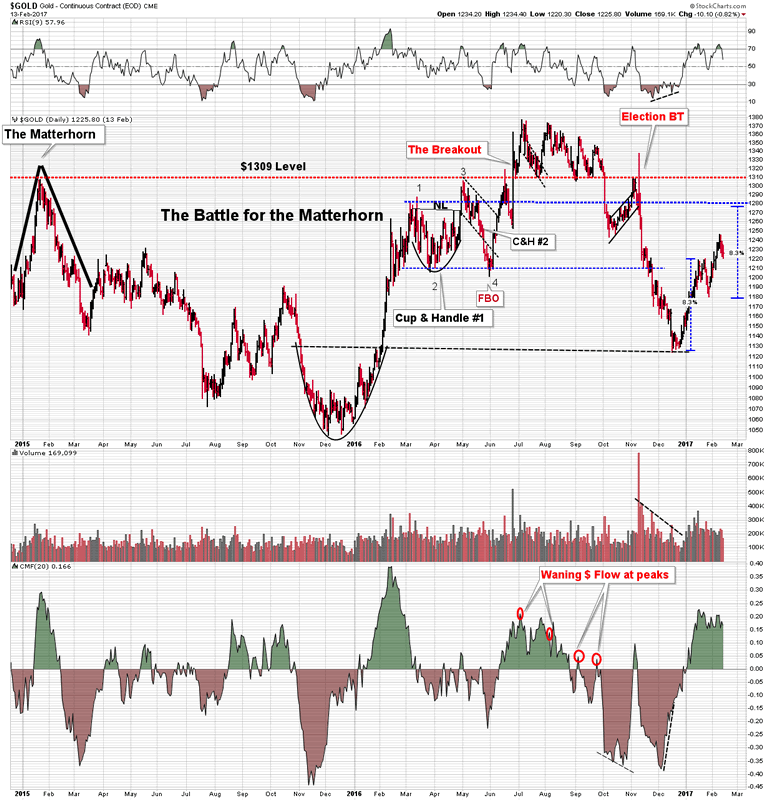
So my alternative view is the 2016 rally was just a BMR which reset market psychology by generating a giant false breakout over the $1309 level, which was the previous high. If the gold price cannot exceed the July 2016 highs its telling us that this entire affair may just have been a gold bug mirage and the current rally may just be a reflex bounce off of previous support of $1120. If this is the case, a likely point which we could observe failure would be the $1280 level or possibly lower.
Developing the $1280 Price objective
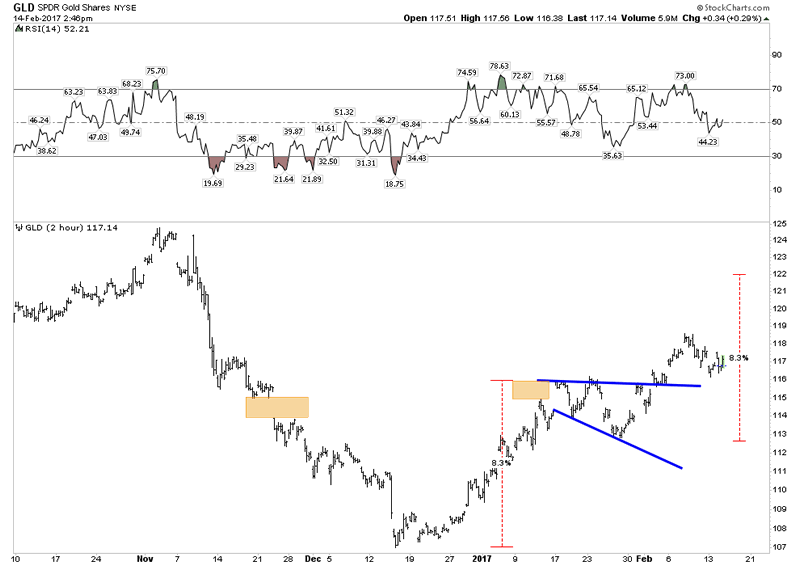
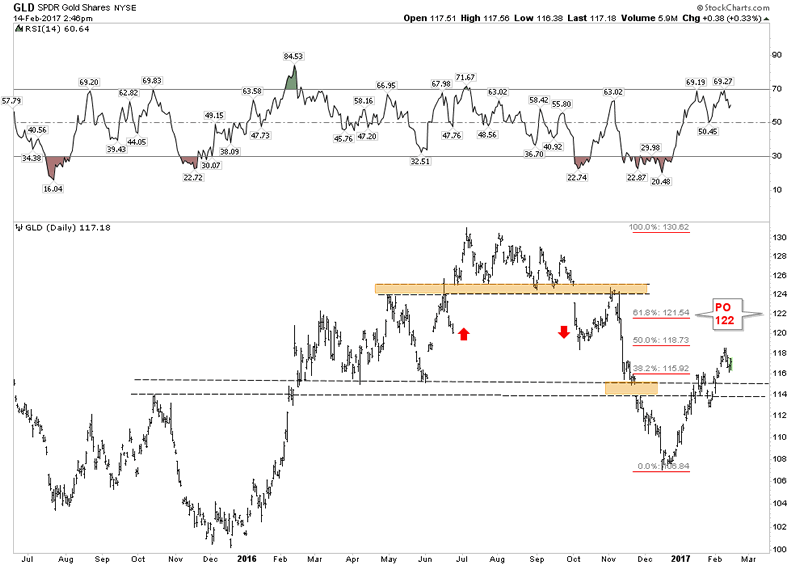
Other charts point towards the $1280 level as a price objective. Below are 2 charts of the GLD, these are inspired by Rambus' work. The first chart shows an impulse measured move to the GLD 122 price level. This equates to about the $1280 level in the gold price. The second chart shows how this level coincides with the Fib 61.8% rettracement of the entire gold breakdown we saw from July through December. This level would be a powerful backtest.
The Headtest
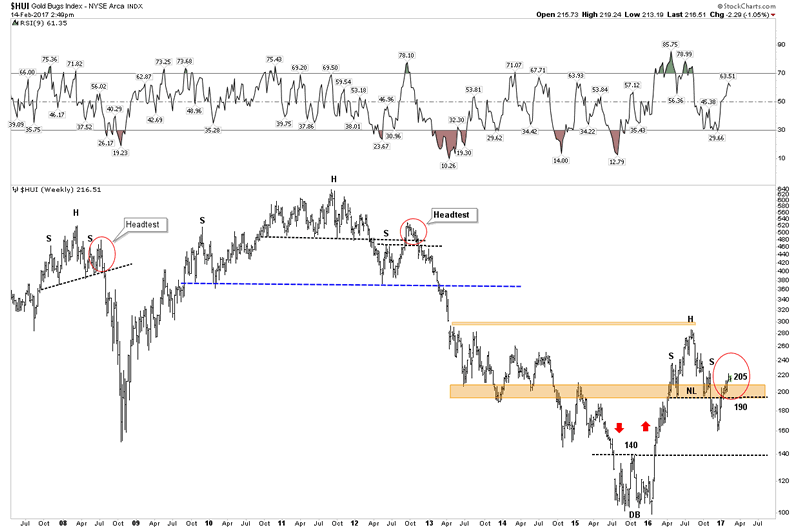
I have developed a principle which I call the headset, which is one of Mr. Bears operating tools. Before a price really collapses it often undergoes a violent upsurge. This upsurge squeezes the shorts and forces them to cover. The market can now fall without the savvy short sellers on board with their trades. Mr. Bear has completed his assignment as Mr. Market can now reach his objective with the fewest operators able to profit. Sounds demented I know, but that’s how Mr. Market likes it, he likes to travel distances without any partners. Sick, I know.
So here are two examples of the headtest in action. Review these then ask yourself, is this what the current rally is – a head test? Note the two red circles Jul 8 2008 and 17 Sep 2012. These head tests served to squeeze out short interest and draw in the skeptical bulls right before a major decline. So one has to beware of a rally on the right side of a H&S it may be a head test.
HUI Price Objective
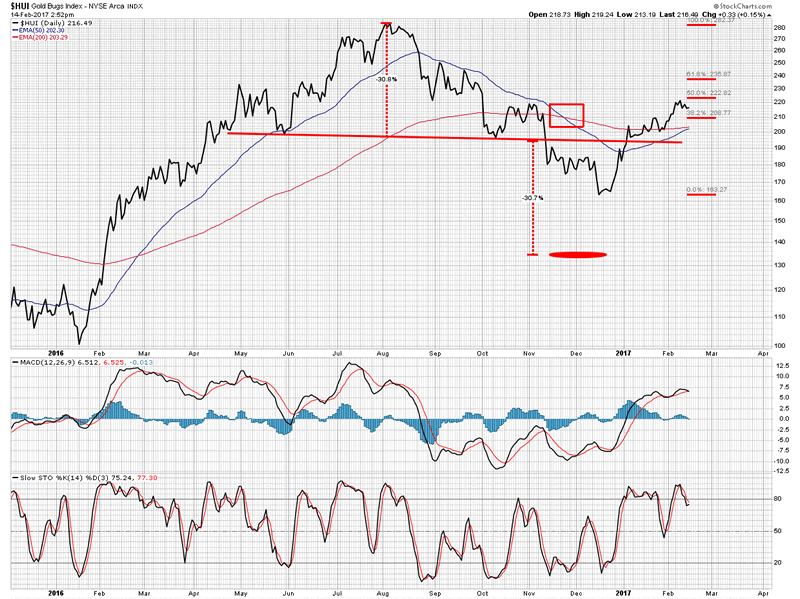
If this current rally fails and the HUI 190 level is violated what could be in store? That grim outcome would point towards an eventual price objective of HUI 130. Its simply a measured move of the rather large sized H&S pattern built out over the past 9 months. If this were to occur the 130 HUI level would be a point to regroup and reassess. It may or may not prove to be a final bottom.
King Dollar and the force
So what’s the force behind all of this, what’s the macro? A post bubble contraction begins after peak credit is achieved on a secular basis. This contraction is the process where economies must delever in order to grow. Credit has reached a level where it impairs growth and must be reduced or reset. This is a long process, normally taking around 20 years. The credit cycle peaked in 2007 and we are now 10 years into the post bubble contraction. This is not a new phenomenon, it is world wide and is the seventh such cycle since the era of modern finance began in the 1600’s. Remnants of this cycle existed even in biblical times, you may be familiar with the year of jubilee.
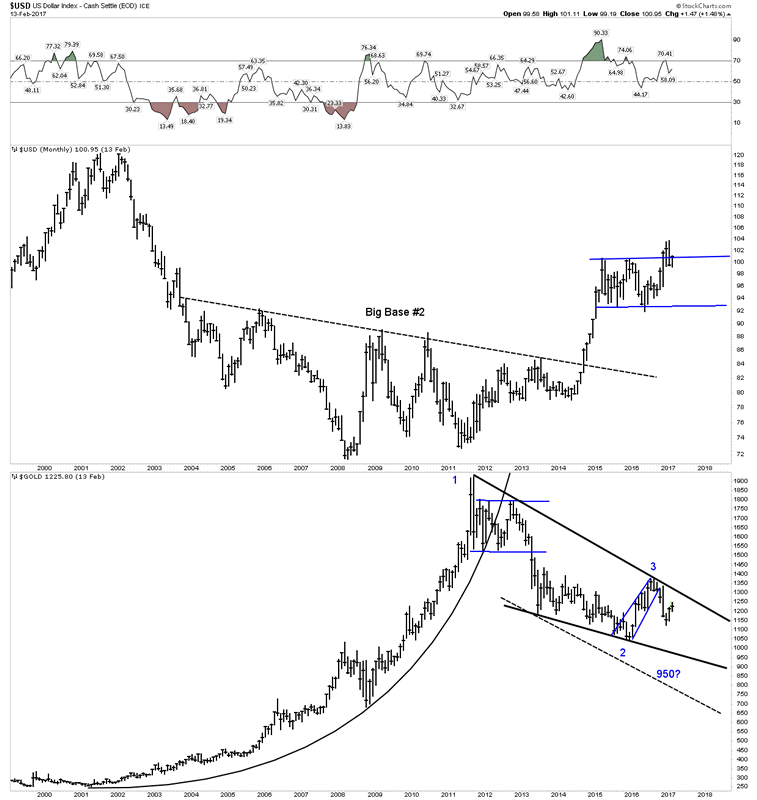
During the boom years credit is denominated in the world’s senior currency (USD). Extending credit effectively is a synthetic short of the USD. Credit default or actual repayment covers this short, thus bolstering the USD. This dynamic is occurring now and the senior currency is acting as a magnet to capital around the world. The US Dollar strengthens and REAL interest rates are rising. This is not bullish for gold in the early stages as the currency is competition to gold. As the USD rises eventually it caused severe financial implications to marginal economies around the world ultimately leading to turmoil. Once this turmoil reaches a given threshold it will cause a phase shift and act as a tailwind for gold. At this point gold and the USD can rise together. Until then the USD moves opposite to gold.
That’s the macro case depicted in the chart below created by Rambus of Rambus chartology. We can see the USD midway into a major impulse move higher. Its measured price objective is up around 118-120. For the past two years the USD has been consolidating the move out of its base. It is currently finishing up a hard backtest after its recent breakout from that 2-year consolidation. During this backtest gold has been rallying since mid-December. Once the upward move in the USD resumes history indicates it will be bearish for gold, but until then it remains a permissive environment for gold and it can continue its rally. In the chart below we can see that gold will encounter resistance around the $1280 level. Recall that is also my Matterhorn measured move price objective.
A much higher USD, would blow a chilly deflationary wind throughout the world. Ultimately economies would face collapse and central banks would be forced to respond. Their response would likely lite a fire under gold, thus propelling it into a wild bull market.
The Trade
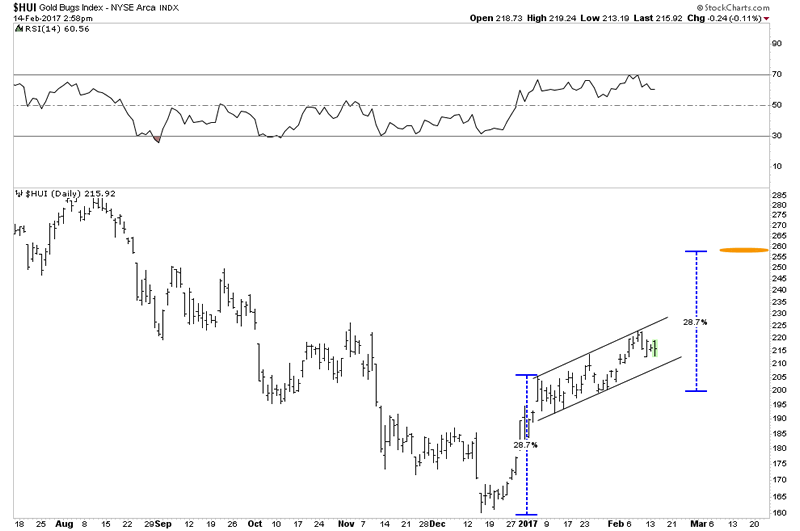
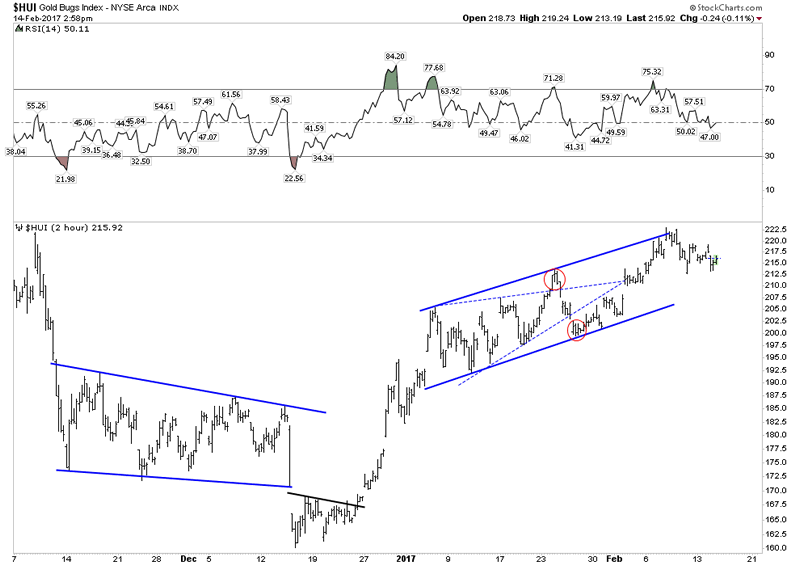
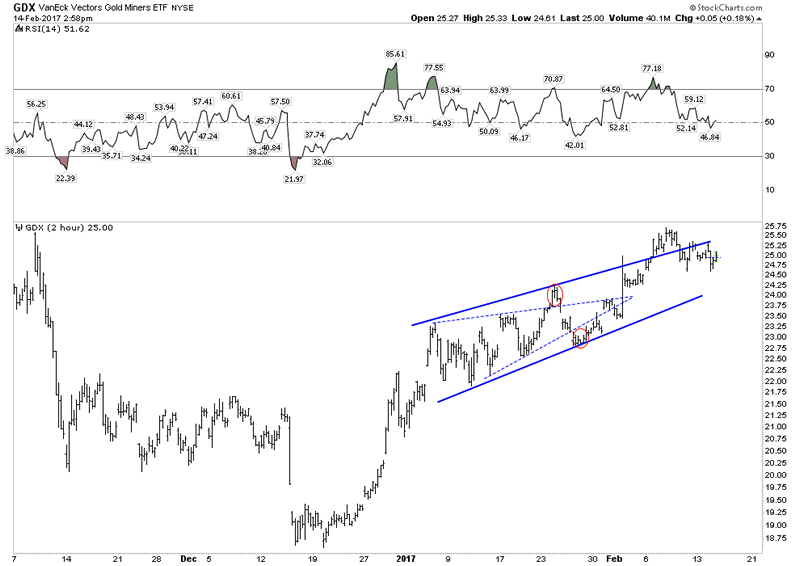
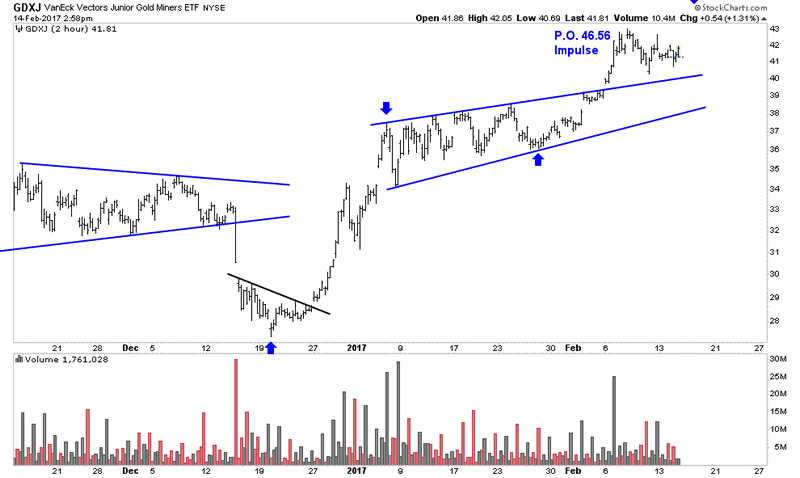
As long as the USD does not resume its upward impulse gold and the stocks can continue to rally. The charts point towards several price objectives which may be achieved within the timeframe of March/April. These price objectives include HUI 255 and GDXJ 46.56. Charts below depict the breakout process where we see the GDXJ as the stronger index.
The perfect bottom-what would it look like?
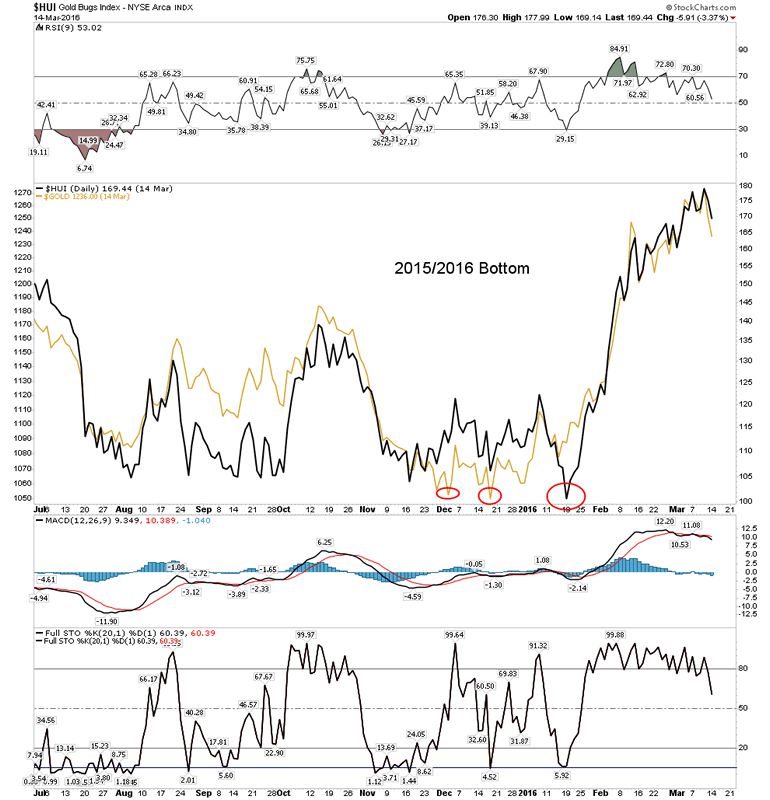
If the bottom we witnessed in gold and the HUI was not the “real” bottom are there any other clues to indicate this? Apparently yes. The classic gold market bottom scenario typically unfolds as follows: the gold mining stocks form a bottom 3-5 months before the metal finds its bottom. Informed investors sniff out the impending bottom and start to bid up the stocks anticipating a turn in the metal. So the price low comes first in the stocks and the advance is well on its way when the bottom comes in on the metal. That’s a description of the price action, whereas the psychology also tells a descriptive story. Typically the stocks bottom out in a micro burst of selling known as capitulation. At the end of prolonged bear markets the market occasionally goes no bid for up to 3-5 days. This lock-up of liquidity enables a rare dynamic of comical selling. This is where rattled investors simply give up and call their brokers and say SELL IT!. Since there are few bids prices can drop to ridiculous levels, in fact comical levels, hence the term. Illiquid shares dropping 50% intra day just to accommodate a panicked exit.
We never witnessed this phenomenon in the Jan 2016 bottom. There is no market law that says we have to, but the fact that we never had the liquidity lock-up and comical selling means we didn’t have that illusive perfect bottom. The bottom of 2016 was somewhat of a mixed bag. What we had was stocks putting in a final low 6 weeks after gold put in its final low. Both asset classes spent about 5 months tracing out a bottom together, but gold made the first move higher. So the classic price sequence was reversed, gold actually bottomed 6 weeks before stocks, plus we never got a capitulation blow out. It remains to be seen whether the massive 2011 bear market which delivered an 80-90% decline finishes with such a knock out punch. The chart below chronicles the bottom and the interplay of gold vs the stocks. Note gold bottomed before the HUI, which is counter to tradition and they both ran essentially in tandem during their bottoming action.
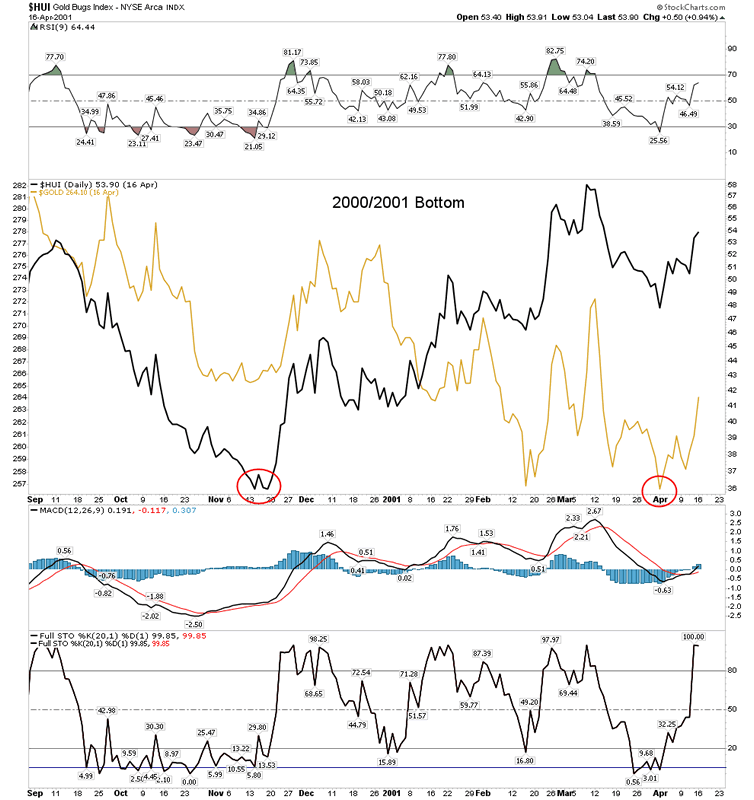
The 2000/2001 bottom- A text book case
When we review the bottom which launched the 10 year bull market from 2001-2011 we see a more traditional “classic” bottom. In fact its pretty much text book. Here we see the stocks putting in a tight double V-shaped bottom caused by cathartic selling. Once the bottom was in the stocks began discounting a turn in the metal. Note this turn came a full 4.5 months before the metal. In fact even though the stocks were well into their rally up 50%, gold still was so unsure of itself that it had to put in a broad based double bottom with the second bottom the lower of the two. This of course set-up a huge positive divergence between the stocks and metal. This was a beautiful text book bottoming sequence.
Conclusion
Until gold and the PM miner indexes either exceed the August highs or violate the 2016 lows no one can say for certain we are in either a bull or bear market. Mr. Market has used his two operatives Mr. Bull and Mr. Bear to sufficiently disguise the markets true hand. We will wait and see what clues we can discover in order to determine how to commit out capital.
Good Luck,
Plunger
Copyright © 2016 Plunger - All Rights Reserved
All ideas, opinions, and/or forecasts, expressed or implied herein, are for informational purposes only and should not be construed as a recommendation to invest, trade, and/or speculate in the markets. Any investments, trades, and/or speculations made in light of the ideas, opinions, and/or forecasts, expressed or implied herein, are committed at your own risk, financial or otherwise. The information on this site has been prepared without regard to any particular investor’s investment objectives, financial situation, and needs. Accordingly, investors should not act on any information on this site without obtaining specific advice from their financial advisor. Past performance is no guarantee of future results.
© 2005-2022 http://www.MarketOracle.co.uk - The Market Oracle is a FREE Daily Financial Markets Analysis & Forecasting online publication.


