


Bifurcated US Stock Market
Stock-Markets / Stock Market 2017 Apr 29, 2017 - 03:26 PM GMTBy: Tony_Caldaro

 The market started to week at SPX 2349. After a gap up opening on Monday, and another gap up opening on Tuesday, the market hit SPX 2398 by Wednesday. After that it pulled back to end the week at SPX 2384. For the week the SPX/DOW gained 1.70%, and the NDX/NAZ gained 2.45%. Economic reports for the week were mostly negative. On the downtick: consumer confidence/sentiment, durable goods, pending home sales, Q1 GDP, the WLEI, plus weekly jobless claims rose. On the uptick: Case-Shiller, new home sales and the Chicago PMI. Next week’s reports will be highlighted by the FED’s FOMC, the ISMs, and monthly payrolls. Best to your week!
LONG TERM: uptrend
The bull market put in a positive twist this week after the French elections over the weekend. Before even reaching our minimum downside targets for this downtrend markets worldwide gapped up on Monday, continued higher on Tuesday, and then stalled at higher levels for the rest of the week. This activity has created a temporary bifurcation between the US cyclicals and tech sectors. A rare occurrence, but nothing that has not happened before. In time, sometimes as long as 6 months, the two sectors will realign. For now we have the cyclicals barely still in a downtrend, and the techs continuing their uptrend.
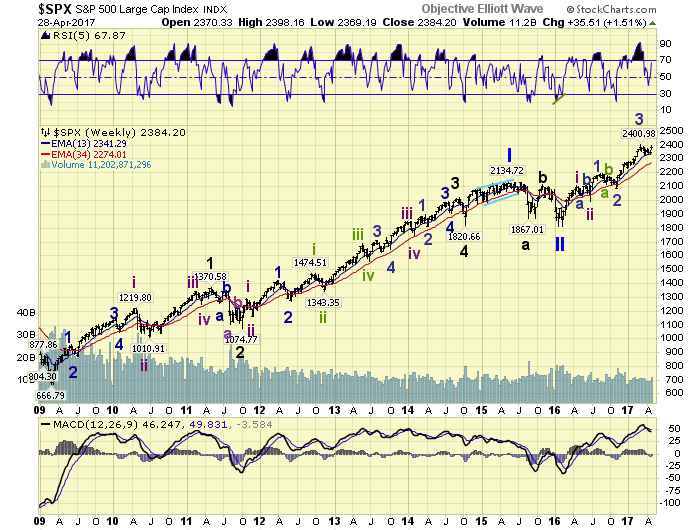
Longer term the count in the SPX remains the same. Intermediate waves i and ii in the spring of 2016. Then Minor waves 1, 2, 3 and 4 between June 2016 and April 2017. The current rally, which is already two weeks old, is either Minute B of Minor 4 or Minor 5. As for the Tech sector, they are still clearly in Minor wave 3. Since this can resolve itself in several ways, we’ll just let the market unfold and see what develops. In the mean time the long term target remains unchanged: SPX 3000+ between 2018 and 2020.
MEDIUM TERM: close to confirming an uptrend
In a review of the charts we found some interesting clues to the Minute B/Minor 5 dilemma. The SOX, R2K, XLB, and XLK have already confirmed uptrends after a recent downtrend. The XLP, XLY, XLU and HGX never confirmed a downtrend and are still uptrending like the NDX/NAZ. This suggests about 70% of the US sectors we follow are currently in confirmed uptrends. In the foreign markets the SMI and TSX just reversed into uptrends, while the DJW, ASX, NFTY, CAC, DAX, HSI, IBEX, MIB and STI didn’t experience a recent downtrend. This suggests over 70% of the foreign markets are in confirmed uptrends too. Probabilities suggest a SPX uptrend should be confirmed soon.
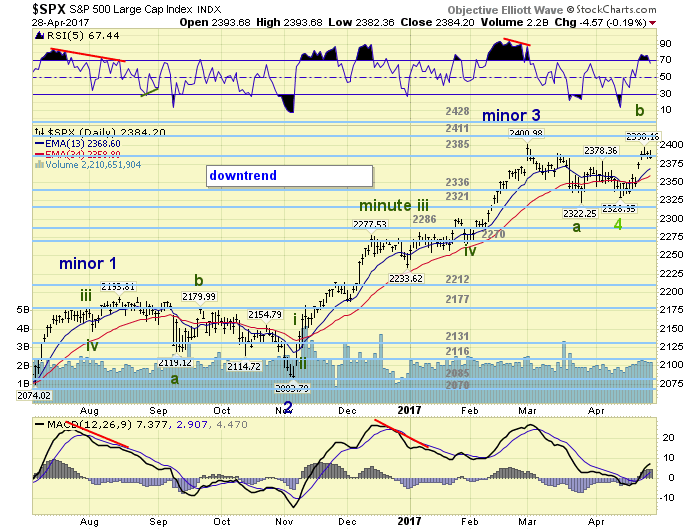
If Minor wave 4 did end in April at SPX 2329, it will be labeled as a C wave failure since the A wave declined to 2322 in March. And, might explain the explosive move upwards this week. If this advance is a B wave rally, within another complex correction, then the SPX 2322 level would remain wave A. The C wave to follow will then probably retest those recent lows in conjunction with downtrends in the NDX/NAZ. Medium term support is at the 2336 and 2321 pivots, with resistance at the 2385 and 2411 pivots.
SHORT TERM
From the April SPX 2329 low we currently count three waves up: 2361-2345-2398. The late-week decline to SPX 2382 is a pullback of some degree, but not yet sufficient to figure into the larger short term count. These three waves can either be a 1-2-3 or an a-b-c off that low. Thus far it looks impulsive after a choppy beginning.
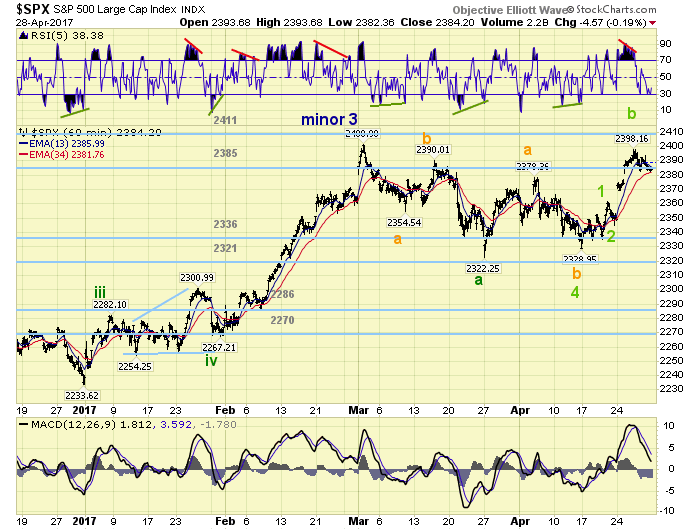
Should the recent rally reverse we see support in the SPX 2320’s and then around SPX 2300. Worse case would be the 2286 and 2270 pivot ranges. Should the rally continue there is initial resistance at the 2411 and 2428 pivots. Then little resistance until the 2488 pivot. Short term support is at SPX 2369 and the 2336 pivot, with resistance at the 2385 pivot and SPX 2401. Short term momentum ended the week with what looks like a potential positive divergence. Best to your trading!
FOREIGN MARKETS
Asian markets were mostly higher for a net gain of 1.5%.
European markets were all higher and gained 2.4%.
The DJ World gained 1.9%, and the NYSE gained 1.3%.
COMMODITIES
Bonds continue to uptrend but lost 0.2%.
Crude is now in an uptrend but lost 0.6%.
Gold is also in an uptrend but lost 1.6%.
The USD remains in a downtrend and lost 1.0%.
NEXT WEEK
Monday: personal income/spending and the CPI at 8:30, then ISM and construction spending at 10am. Tuesday: auto sales. Wednesday: the ADP, ISM services and the FOMC. Thursday: weekly jobless claims, the trade deficit, and factory orders. Friday: monthly payrolls, consumer credit, then one speech from the FED vice chair and another from the FED chair. Best to your weekend and week!
CHARTS: http://stockcharts.com/public/1269446/tenpp
After about 40 years of investing in the markets one learns that the markets are constantly changing, not only in price, but in what drives the markets. In the 1960s, the Nifty Fifty were the leaders of the stock market. In the 1970s, stock selection using Technical Analysis was important, as the market stayed with a trading range for the entire decade. In the 1980s, the market finally broke out of it doldrums, as the DOW broke through 1100 in 1982, and launched the greatest bull market on record.
Sharing is an important aspect of a life. Over 100 people have joined our group, from all walks of life, covering twenty three countries across the globe. It's been the most fun I have ever had in the market. Sharing uncommon knowledge, with investors. In hope of aiding them in finding their financial independence.
Copyright © 2017 Tony Caldaro - All Rights Reserved Disclaimer: The above is a matter of opinion provided for general information purposes only and is not intended as investment advice. Information and analysis above are derived from sources and utilising methods believed to be reliable, but we cannot accept responsibility for any losses you may incur as a result of this analysis. Individuals should consult with their personal financial advisors.
Tony Caldaro Archive |
© 2005-2022 http://www.MarketOracle.co.uk - The Market Oracle is a FREE Daily Financial Markets Analysis & Forecasting online publication.