


What an America First Trade Policy Could Mean for the US Dollar
Commodities / Crude Oil May 22, 2017 - 02:46 PM GMTBy: John_Mauldin

 JACOB L. SHAPIRO : It was only a few months ago that OPEC, once the de facto arbiter of oil markets, seemed to have a plan to inflate the price of oil: The cartel, along with several non-OPEC members, agreed in December to cut production by roughly 1.2 million barrels per day.
And for the first quarter of 2017, OPEC largely made good on its pledge. It produced 1.1 million fewer barrels of oil per day in the first quarter of 2017 than it did in the final quarter of 2016. Saudi Arabia, OPEC’s largest producer, accounted for 55% of the cuts.
And yet on May 4, oil prices reached a new low for the year, dropping to roughly $48 per barrel and hovering there ever since. The original deal wasn’t meant to return oil prices to previously high levels; it was meant only to keep them from crashing altogether.
Still, the plan appears to be failing, and its failure bodes ill for Saudi Arabia—and for Russia, which was a little disingenuous in how much its own cuts would affect prices.
The Saudis Cannot Dictate Prices
Saudi Arabia can shoulder so much of the burden of production cuts because, unlike most other countries, it has roughly $500 billion of reserves to fall back on. Put simply, it can afford short-term losses that other countries cannot. When prices are in the $50 per barrel range, as they have been for most of 2017, Riyadh doesn’t have to dip too far into its reserves to cover its budget deficit.
But the prospect of low prices, not to mention the reinstatement of government spending on public sector salaries and bonuses, means that Riyadh will soon feel the pain that so many other countries have felt for some time. The days when Saudi Arabia could dictate market prices by itself have passed. And so the country needs to do what it can to maximize value now, before its ability to dictate the market wanes further and before it invests even more money into diversifying its economy.
There are, of course, reasons that oil prices are falling that are beyond Riyadh's control. The United States, for example, has increased production—something it tends to do when prices reach producers’ break-even point in the $50 per barrel range.
Projections by the US Energy Information Administration (EIA) from late 2016 estimated that the US would produce 8.7 million barrels per day in 2017. The EIA has already begun to revise its forecast upward: New estimates suggest the country will produce 9.2 million barrels per day in 2017, and perhaps as much as 10 million barrels per day in 2018. If these rates continue, the US would produce more crude oil than Saudi Arabia would if it, too, maintained current rates.
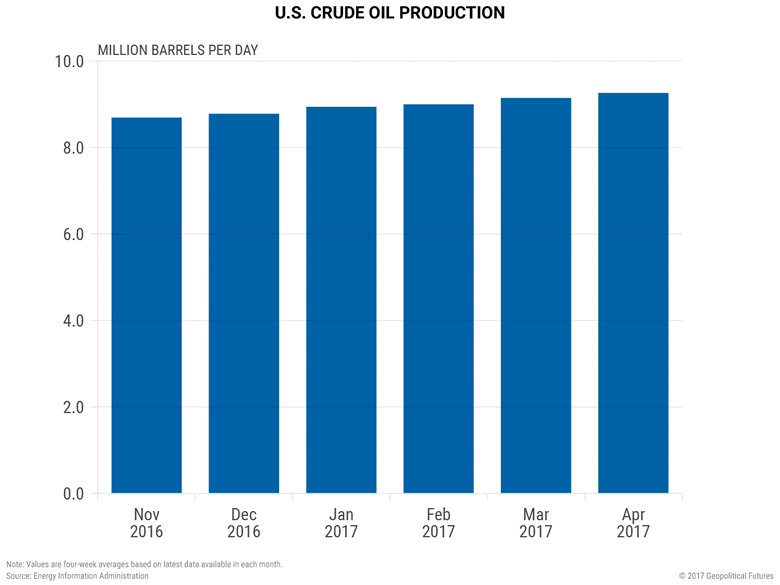
Source: Geopolitical Futures
Russia’s Cuts
Then there is Russia, which has arguably misrepresented how closely it has adhered to the December agreement. This is because Russia simply can’t afford to cut production. Russian Energy Minister Alexander Novak has said Russia met its promised cuts of 300,000 barrels per day. Russian Energy Ministry statistics suggest that number may even be 400,000 barrels.
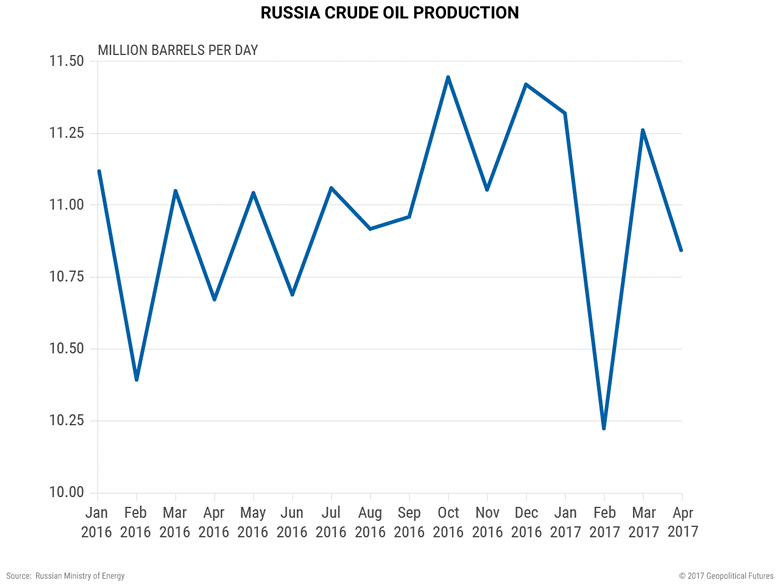
Source: Geopolitical Futures
But these numbers are misleading. Decreased production and intentional cuts aren’t the same thing. There was a similarly steep drop in Russian production—432,000 barrels per day—at this time in 2016, raising the question of whether this is just a monthly seasonal adjustment.
Crude oil production cuts are in the eye of the beholder. Russia has technically met its obligation to cut 300,000 barrels per day if the benchmark for the cuts is December 2016. Russia has not met its obligations, however, if the standard is a year-on-year comparison of cuts.
As the chart above shows, Russia raised crude production in January and March 2017 when compared with the previous year. The April 2017 decrease in production, when viewed year-on-year, is just over half of Russia’s commitment to OPEC.
The ebbs and flows of oil prices, for whatever their reasons, are best analyzed by oil experts. The bottom line is that there is more supply than demand, and when the price hits a certain point, US production begins to kick in, increasing supply and offsetting other cuts agreed to by OPEC and non-OPEC countries.
That puts a ceiling on the price of oil, putting countries such as Russia that depend on oil exports in a difficult situation. Moscow could afford a short-term production cut if cutting production put prices into the $70 and $80 per barrel range. But it could not afford a short-term cut that would close production facilities because of how dependent some regions in Russia are on oil.
A long-term production cut to keep the bottom from falling out of oil prices would also be difficult for Russia to maintain. After all, it’s already on pace to exhaust one of its reserve funds this year.
Forecasts on Track
With Russia unable to stomach even a short-term cut, the bulk of the responsibility for decreasing production has fallen to Saudi Arabia, which has a large but not-inexhaustible amount of money to cover losses.
The result is that Geopolitical Futures' 2017 forecast on Russia, which identified Russian aggressiveness abroad and political instability at home as the key drivers of Russia’s geopolitical situation in 2017, is on track. The same is true of GPF’s forecast on Saudi Arabia, which predicts that Saudi Arabia is standing on the brink of an existential political crisis that a Saudi Aramco IPO and a “Vision 2030” will not be able to avert.
OPEC bought itself some time with its agreement to cut production in December. But it now faces the difficult choice of ending those cuts and watching prices fall (an untenable choice for most OPEC and non-OPEC countries), or continuing those cuts to keep prices at their current levels—an increasingly difficult thing to guarantee, given producers’ history of adhering to OPEC agreements.
Sooner or later, the result is going to be lower oil prices, at which point many of the predictions that GPF made at the beginning of the year will begin to form more quickly.
Grab George Friedman's Exclusive eBook, The World Explained in Maps
The World Explained in Maps reveals the panorama of geopolitical landscapes influencing today's governments and global financial systems. Don't miss this chance to prepare for the year ahead with the straight facts about every major country’s and region's current geopolitical climate. You won't find political rhetoric or media hype here.
The World Explained in Maps is an essential guide for every investor as 2017 takes shape. Get your copy now—free!
John Mauldin Archive |
© 2005-2022 http://www.MarketOracle.co.uk - The Market Oracle is a FREE Daily Financial Markets Analysis & Forecasting online publication.