


Bearish Head and Shoulders in EURUSD?
Currencies / Forex Trading May 26, 2017 - 10:45 AM GMTBy: Enda_Glynn

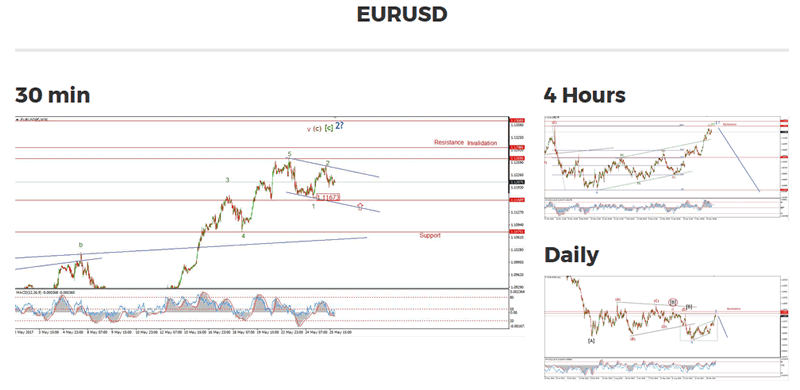
 My Bias: short in wave 3 blue.
Wave Structure: downward impulse wave 1, 2 blue
Long term wave count: lower in wave 3 blue
Important risk events: EUR: N/A. USD: G7 Meetings, Core Durable Goods Orders m/m.
Evening all.
Its been a cracker of a day weather wise here in Ireland,
the markets have been slumbering in the heat, and proved a pain to watch, paint drying comes to mind!
EURUSD is flat on the day, which does fit with the current short term count.
That chart is beginning to show a nice head and shoulders pattern around the recent high, which is also good.
The decline this evening has an impulsive look to it, which may prove to be the beginning of wave '3' green.
A break of 1.1163 will signal that wave '3' green is under way.
On the daily chart I have shown a viable alternate view on the end of the recent contracting triangle wave [B] black.
That alternate high is at 1.1369.
Wave '1' blue then forms a clear declining wedge to the downside off that high.
This alternate count allows a little wiggle room to the upside for the invalidation point of the bearish setup.
For tomorrow, I am watching 1.1163, an impulsive move below that level will kick off wave '3'.
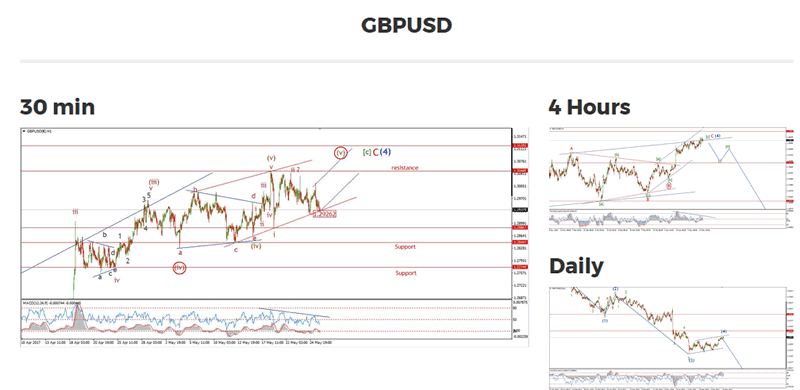
My Bias: short below parity.
Wave Structure: continuing impulsive structure to the downside in wave (5)
Long term wave count: decline in wave (5) blue, below parity
Important risk events: GBP: N/A. USD: G7 Meetings, Core Durable Goods Orders m/m.
Todays price action has not cleared the waters yet between the two viable wave counts.
But;
Given the choppy indecisive action in cable again today,
the alternate wave count now looks more likely than not.
Yesterdays low of 1.2926 has held so far.
And the rising alternate trend line in red has supported the price on two consecutive days.
The low at 1.2886, remains the trigger point for the next decline.
A break of that low will shift the bias to the downside again.
Lets see what the overnight brings us,
another rise within that blue trend channel will be another signal in favor of the alternate wave (v) brown.
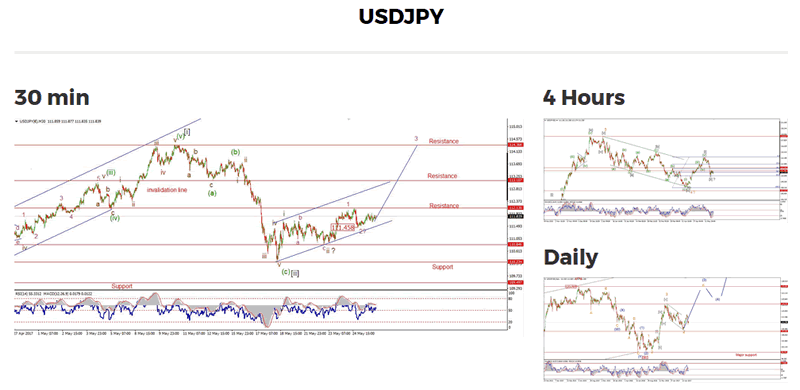
My Bias: LONG
Wave Structure: rally in wave [C]
Long term wave count: wave [C] is underway, upside to above 136.00
Important risk events: JPY: N/A. USD: G7 Meetings, Core Durable Goods Orders m/m.
USDJPY is now displaying consecutive 1,2 waves to the upside at three degrees of trend!
The low at wave 'ii' brown, 110.84 is the key short term support in this bullish interpretation.
The current wave count calls for a sizable rally in wave '3' pink very soon.
A break of 112.13 will likely signal the beginning of wave '3'.
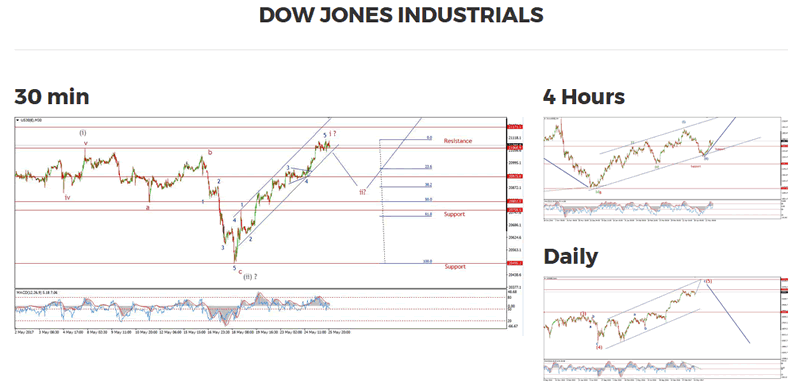
My Bias: market topping process ongoing
Wave Structure: Impulsive 5 wave structure, possibly topping in an all time high.
Long term wave count: Topping in wave (5)
Important risk events: USD: G7 Meetings, Core Durable Goods Orders m/m.
On the 05/17/17, I was pondering the possibilities for a serious rally in the DOW.
price stood at 20599 and today price hit 21110 at the high.
SO, we have had a nice 500 point rally since that point,
and wave 'i' pink is now showing signs of exhaustion.
Now it is time to turn our focus lower for the next few days in a possible wave 'ii' pink.
On that note, there is a nice cluster of support levels between 20925 and 20795,
The 50% retracement level lies at 20802.
So the focus tomorrow is towards the beginning of wave 'ii' pink.
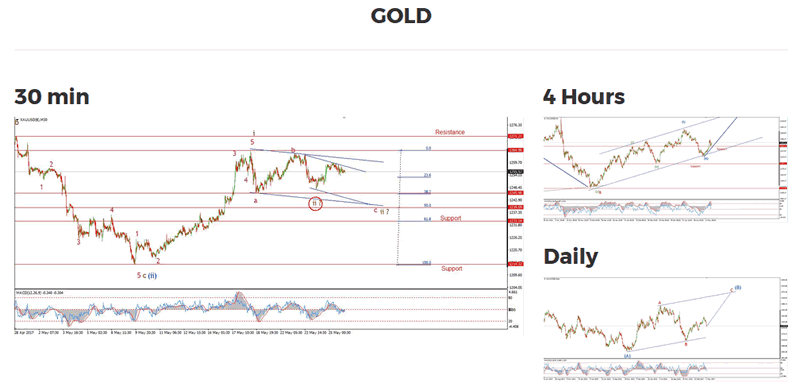
My Bias: Long towards 1550
Wave Structure: ZigZag correction to the upside.
Long term wave count: Topping in wave (B) at 1550
Important risk events: USD: G7 Meetings, Core Durable Goods Orders m/m.
GOLD was pretty flat on the day, which point to an ongoing correction.
the wave count has not altered since yesterday,
The most likely outcome from here is one more decline to complete wave 'ii' brown.
I have shown two trend channels at two degrees of trend,
The lower intersecting lines point to a low at 1240, which is right on the money with the 50% retracement level.
Keep in mind the alternate wave count shown circled in red.
This interpretation views wave 'ii' brown as a running flat correction.
A break of the wave 'b' high at 1263.61 will confirm the alternate view.
For now, I am focused on the lower target as the preferred option.
Enda Glynn
http://bullwaves.org
I am an Elliott wave trader,
I have studied and traded using Elliott wave analysis as the backbone of my approach to markets for the last 10 years.
I take a top down approach to market analysis
starting at the daily time frame all the way down to the 30 minute time frame.
© 2017 Copyright Enda Glynn - All Rights Reserved
Disclaimer: The above is a matter of opinion provided for general information purposes only and is not intended as investment advice. Information and analysis above are derived from sources and utilising methods believed to be reliable, but we cannot accept responsibility for any losses you may incur as a result of this analysis. Individuals should consult with their personal financial advisors.
© 2005-2022 http://www.MarketOracle.co.uk - The Market Oracle is a FREE Daily Financial Markets Analysis & Forecasting online publication.