Technical Analysis of US Dollar and AMEX Gold BUGS Index
Commodities / Gold & Silver Stocks Aug 19, 2008 - 05:34 AM GMTBy: David_Petch

 This editorial focuses primarily on the US Dollar Index, with respect to how recent market actions have affected the present consolidation pattern underway since March 2008. The very last chart focuses on the HUI and how the sharp decline nullified the long-term count I was following due to the 0-II trend line being broken. One thing I have learned over the years is that fundamental analysis must be married to technical analysis. It is wrong for someone to assume that Elliott Wave patterns are “the be all end all”…they are a technical tool used to predict future market action based upon the surrounding wave structure. Glenn Neely's pattern base is extremely complicated, which makes tracking patterns even that more difficult.
There has been many a debate on a bulletin board regarding if any of his former rules are no longer applicable. Rules are rules and should never change in the field of science, so if a rule is stated as a rule, it should stand the test of time irrespective of evolving markets. So, please take heed when using technical analysis as “the be all end all”…it should be used as a tool to gauge the market, which could change on a dime, given market sentiment, which is why someone following the markets should watch on a regular basis.
Update of the US Dollar Index
The chart below is a focus to show how strong this present move is. On the left-hand side, the USD index was beneath the index for 4 days, indicating a longer-term bottom (>1 month) was being put in place. At present, the USD index has been above the 55 MA BB for 7 days, which is nearly unprecedented. This clearly indicates strength, but at the same time suggests a strong reversal once a top is put in place. Lower 34 and 55 MA Bollinger bands are still declining and require the 34 MA BB to curl up in order to indicate a top has been put in place. Short-term stochastics have the %K above the %D above the upper horizontal channel line. As it will become clearer towards the end of the article, another 5-10 trading days can be expected before a top in the USD is put in place.
Figure 1
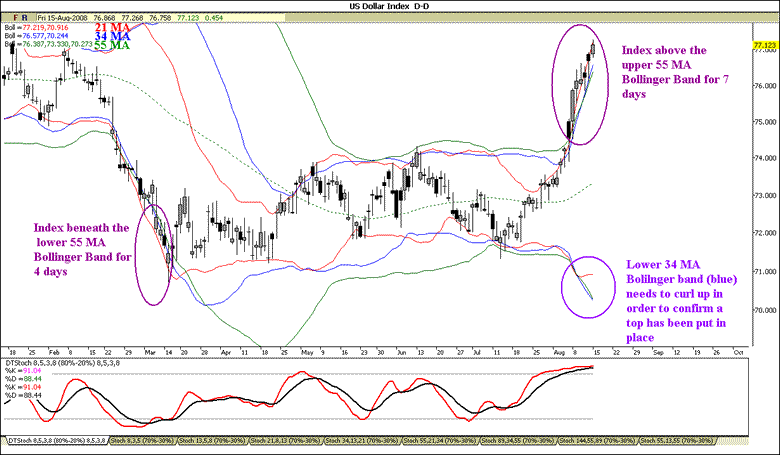
Fibonacci time extensions of various waves are shown near the mid- to upper portion of the chart, with a cluster of Fib dates occurring between now and early September 2008. This suggests another 5-10 trading days potentially exist before a top is put in place and this is confirmed by the lower 34 MA Bollinger band not curling up yet.
Figure 2

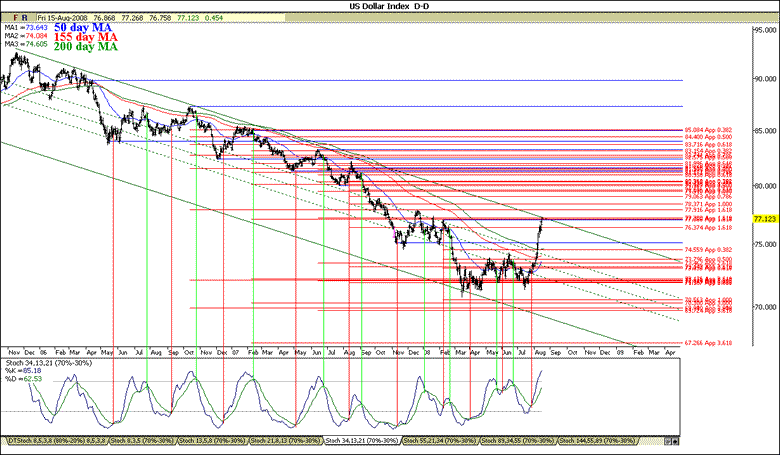
Red lines on the right hand side represent Fibonacci price projections of various downward trending wave price action projected off the termination point of their subsequent corrections. Areas of line overlap form Fib clusters, which indicate important support/resistance levels. Moving averages are in bearish alignment are in bearish alignment (200 day MA above the 155 day MA above the 50 day MA), with the 200 day MA acting as support at 74.6. There is heavy support around 72ish, which is obviously quite a distance from the present level. Full stochastics have the %K from the %D, above the horizontal channel lines with the potential for another 5-10 days of upside before curling down. So, how high does the potential move have to go? This will be addressed in the next few chart and yes, it may surprise a few.
Figure 3
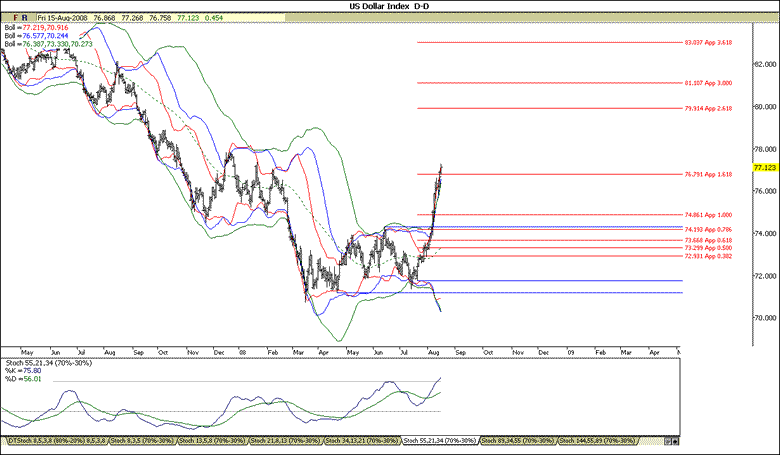
The weekly semi-log chart is shown below, with Fibonacci time extensions of wave a and b (see Figure 6) at the top of the chart, with a cluster of Fib dates occurring on July 31, 2009 . It is of my opinion that this particular date will represent the bottom for wave e or at worst case scenario, the termination point for wave d (again, see Figure 6). Red lines on the right hand side represent Fibonacci price projections of wave a projected off the termination point of wave b…interestingly, the lowest Fib level seen is around 59.change, which happens to intersect the Fib cluster date mentioned above. So, it seems a sharp decline in the USD is going to happen 4-6 months from now, or postponed until mid summer 2009. Full stochastics have the %K above the %D, with establishment of a sharply rising trend, which negates the thought that a positive divergence was forming.
Figure 4

Another small section of chart was required in order to aid in building an appropriate Elliott Wave count to fit the model. Wave (C).[A] presently underway is rising 1.618x above the defined consolidation channel of waves (A).[A] and (B).[B], thereby classifying the pattern as an elongated flat. When elongated flats occur, wave (C) are at least 1.618x wave and less than 2.618x wave (A). Elongated flats are important early warning signs of a triangular formation…so how does this fit into the current pattern of the US Dollar? There is the possibility that the elongated flat is a subwave of a flat structure, which is touched on in Figure 6. My thoughts are the USD will continue to advance to the 79-79.9 level before topping out and heading lower within the consolidation level defined within the thought triangle forming mentioned in Figure 6.
Figure 5
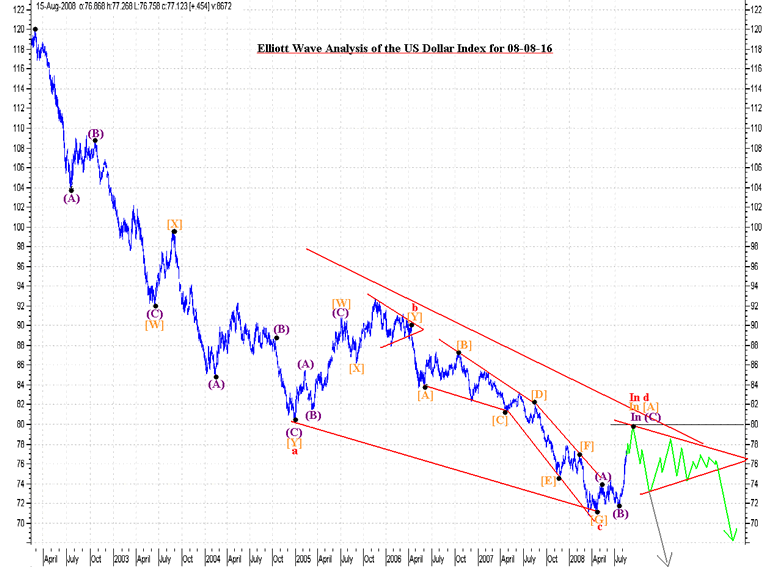
The long-term Elliott Wave chart of the US Dollar Index is shown below, which presents a modified Elliott Wave count in order to fit the model. If one notices, the overall count has not changed, just how the larger Degree count is put together. The prior Figure indicated that an elongated flat formed, requiring it to somehow fit within the picture of the long-term count. It appears that a complex diametric triangle at the Cycle Degree is forming, but there are two different ways presented below for how the elongated flat fits into the picture. In the preferred count denoted in colour, the elongated flat represents wave [A], which is one of only five legs required to complete a horizontal triangle. This pattern would take another 6-8 months before the pattern completes. The other potential structure for wave d is that it is one leg of a flat ( 3-3-5 ) that would take anywhere from 4-6 months before completing the pattern.
The alternate pattern is that the elongated flat represents a leg of the larger Degree Diametric triangle, which would see a sharp continuation in the decline. My thoughts are that some form of a non-limiting horizontal triangle is forming that will carry into early 2009 before heading sharply lower. Should the USD continue to meander sideways for another 10 months, “Katie bar the door” because the price of gold will explode to levels even I can not even fathom. So…watch for the move to continue heading up to 79-79.9 before declining back down to 72-72.5. Longer term, the pattern for the USD just got extremely bearish, because the present larger degree wave structure calls for two more waves down, implying a final bottom anywhere between 40-55 on the index. We will try to zoom in on the expected bottom for the USD and when it will occur. The area of 2012 appears to be the likely bottom…but a refined answer will be presented in the coming weeks.
Figure 6
AMEX Gold BUGS Index
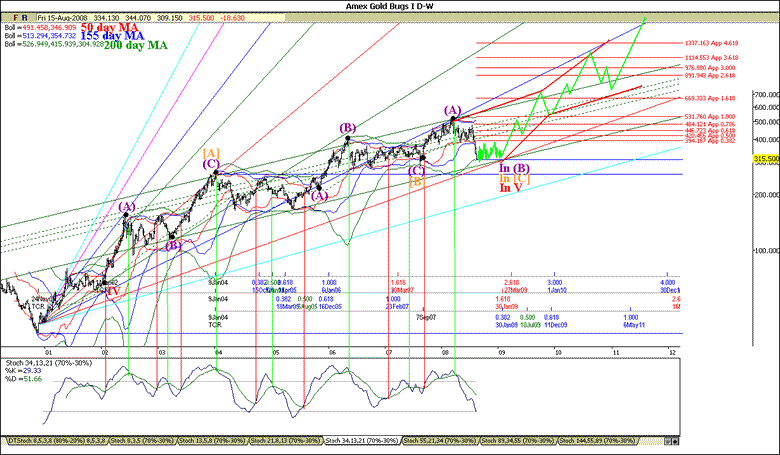
The weekly semi-log chart of the HUI is shown below, and is just as complicated looking as last week. The green lines indicate the thought pattern the HUI will form over the course of the next 3-4 years. There is a plethora of different ways to count this corrective mess, but I am sticking my neck out to go with the shown Elliott Wave count. I have the present move forming a diametric triangle that may or may not have started around last August (it could have started where wave (A).[B] is, which would have the present count in wave (D).[C].V, rather than (B).[C].V…time will tell which is correct). The best case scenario for labeling the HUI as impulsive would be that we are still in wave II…it is a possibility, but I am starting to lean towards the notion that wave V up is going to be purely corrective in nature. Fibonacci time extensions of various waves are shown near the bottom of the chart, with a cluster of Fib dates occurring in mid to late January 2009.
Lower Bollinger bands are now riding the decline, removing any worry I had that it would take until January 2009 for the lower 55 MA BB to hit the HUI. Upper Bollinger bands are all still rising and is going to need around 5-6 months at a minimum before they fan out and see a reduction in overall volatility before the next upward surge commences. It is possible the HUI will have swings between 300-420 over the course of the next 5-6 months, but I would be extremely surprised to see anything above 420 before the New Year. Full stochastics have the %K beneath the %D and is just about to fall beneath the lower horizontal channel line. It will take at least 4-6 months before the %K crosses above the %D, further confirming that a semi-lengthy consolidation process is now underway. Also, notice the way the HUI has carved out a rising channel over the course of the past 6 years. There is lower channel support between 285-300, but as noted earlier, it appears the HUI is attempting to put in a bottom around 310-330.
I believe Glenn Neely is calling for gold to correct for the next 4 years before rising…I do not see this happening, given the global expansion of fiat by government at numerous levels, lending thought to the newly proposed count, while I again stress that other possibilities exist. If anything, I hope the presented count creates discussion for how this pattern may evolve. We are nearing the termination point for peak civilization as we know it and according to Neely's rules or standard Elliott Wave, a final fifth wave can take the dimensions of any form of corrective count (terminal impulse, a diametric or a symmetrical). With this in mind, expect the unexpected.
Figure 7
That is the end of the info on gold that will be presented today…remember to take the opportunity to accumulate gold and silver bullion because supplies are drying up. The gold and silver markets are extremely small, so the market behaviour is running according to the psychology of the large players e.g. hedge funds. The “little guy” is not in the market yet or has been washed out as of late, so until there is a shift in psychology, expect the patterns described above to persist into 2009, possibly as long into June 2009 as a worst case scenario. Please forward any positive or negative comments to accounts@treasurechests.info as it allows us to tweak future editorials on the web to user fit requests.
By David Petch
http://www.treasurechests.info
I generally try to write at least one editorial per week, although typically not as long as this one. At www.treasurechests.info , once per week (with updates if required), I track the Amex Gold BUGS Index, AMEX Oil Index, US Dollar Index, 10 Year US Treasury Index and the S&P 500 Index using various forms of technical analysis, including Elliott Wave. Captain Hook the site proprietor writes 2-3 articles per week on the “big picture” by tying in recent market action with numerous index ratios, money supply, COT positions etc. We also cover some 60 plus stocks in the precious metals, energy and base metals categories (with a focus on stocks around our provinces).
With the above being just one example of how we go about identifying value for investors, if this is the kind of analysis you are looking for we invite you to visit our site and discover more about how our service can further aid in achieving your financial goals. In this regard, whether it's top down macro-analysis designed to assist in opinion shaping and investment policy, or analysis on specific opportunities in the precious metals and energy sectors believed to possess exceptional value, like mindedly at Treasure Chests we in turn strive to provide the best value possible. So again, pay us a visit and discover why a small investment on your part could pay you handsome rewards in the not too distant future.
And of course if you have any questions, comments, or criticisms regarding the above, please feel free to drop us a line . We very much enjoy hearing from you on these items.
Disclaimer: The above is a matter of opinion and is not intended as investment advice. Information and analysis above are derived from sources and utilizing methods believed reliable, but we cannot accept responsibility for any trading losses you may incur as a result of this analysis. Comments within the text should not be construed as specific recommendations to buy or sell securities. Individuals should consult with their broker and personal financial advisors before engaging in any trading activities as we are not registered brokers or advisors. Certain statements included herein may constitute "forward-looking statements" with the meaning of certain securities legislative measures. Such forward-looking statements involve known and unknown risks, uncertainties and other factors that may cause the actual results, performance or achievements of the above mentioned companies, and / or industry results, to be materially different from any future results, performance or achievements expressed or implied by such forward-looking statements. Do your own due diligence.
Copyright © 2008 treasurechests.info Inc. All rights reserved.
Unless otherwise indicated, all materials on these pages are copyrighted by treasurechests.info Inc. No part of these pages, either text or image may be used for any purpose other than personal use. Therefore, reproduction, modification, storage in a retrieval system or retransmission, in any form or by any means, electronic, mechanical or otherwise, for reasons other than personal use, is strictly prohibited without prior written permission.
David Petch Archive |
© 2005-2022 http://www.MarketOracle.co.uk - The Market Oracle is a FREE Daily Financial Markets Analysis & Forecasting online publication.


