


CRUDE OIL UPDATE- “0.30 risk is cheap for changing implication!”
Commodities / Crude Oil Jun 20, 2017 - 04:57 PM GMTBy: Stephen_Cox

 Here are 5 charts of WEEKLY CRUDE OIL, telling their interesting MRI 3D story (TIME, PRICE and DEPTH of 4 chart frames) on MAJOR WEEKLY TURNS. Some of these examples presented potentially low risk to high reward implications. The latest example was presented by CRUDE ADC (Daily) CLQ 17 (44.33) Monday.
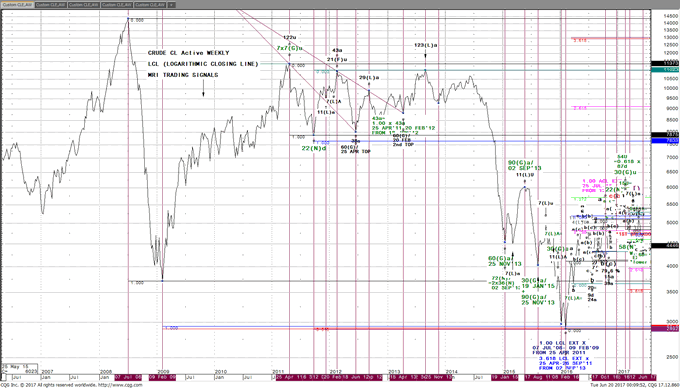
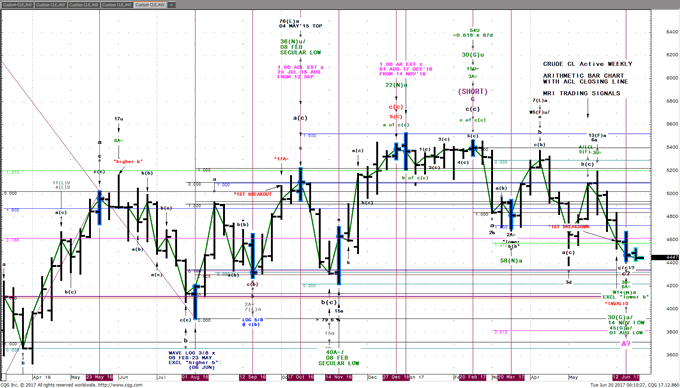
CL (WEEKLY) LCL 2008-2017
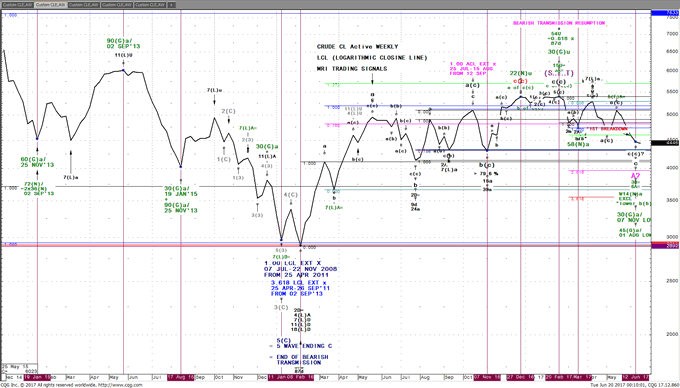
CL (WEEKLY) LCL LOW 2016
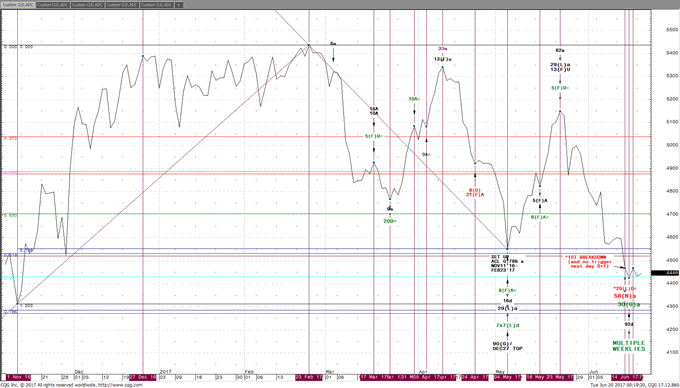
CL (WEEKLY) LOG
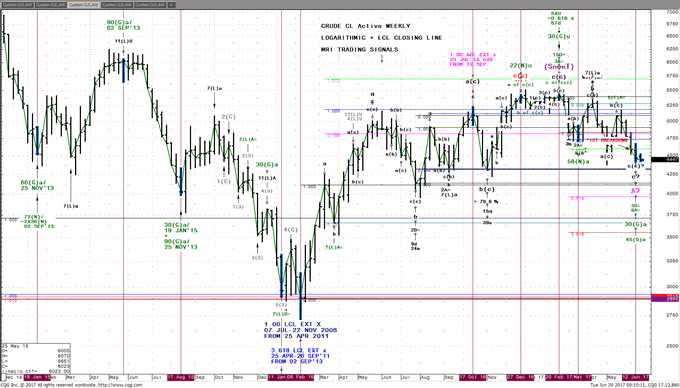
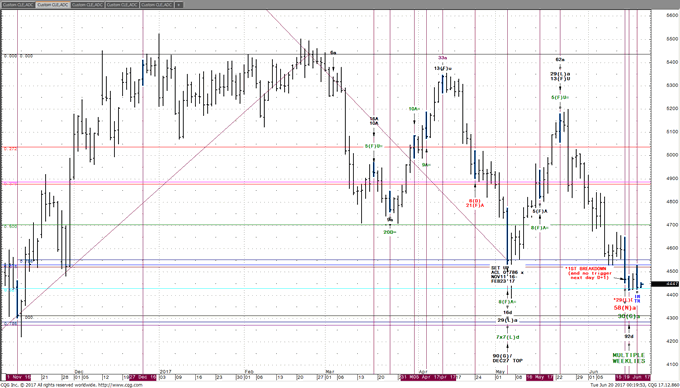
CL (WEEKLY) LOG Zoom
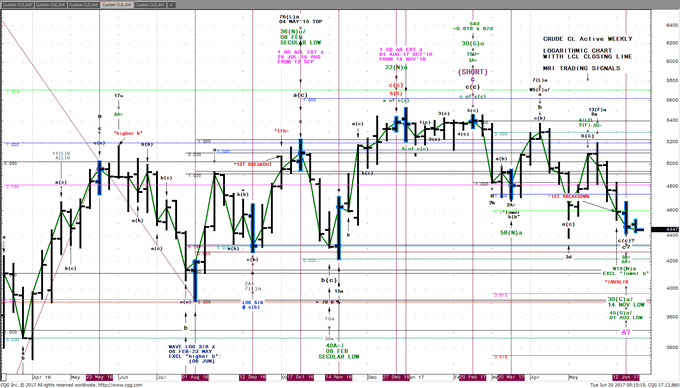
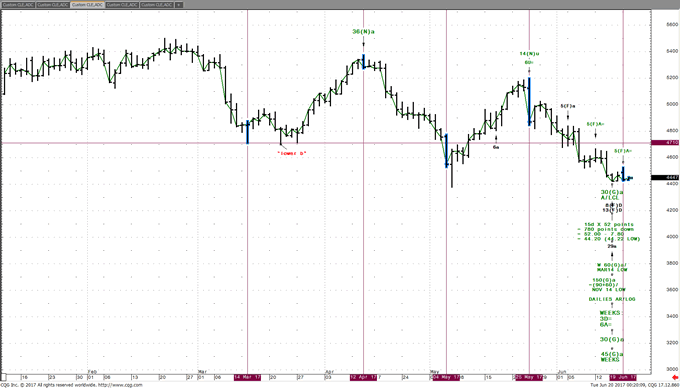
CL (WEEKLY) AR Zoom
Now let’s review even more detail on the ADC (Active Daily).
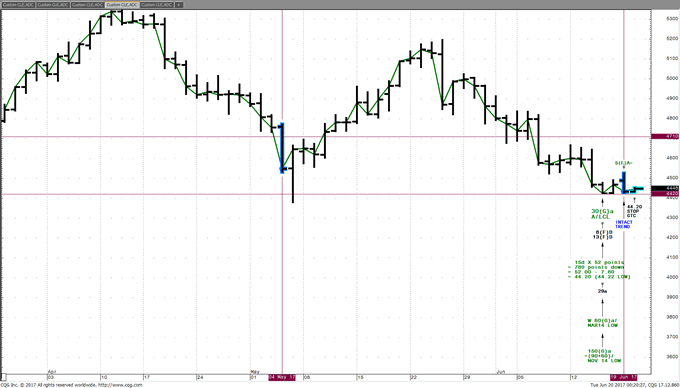
BOTTOM LINE? Since last week, WTI CRUDE is making an awful lot of fuss in WEEKLY and Daily TIME lately about bottoming! It really doesn’t do that unless that is its intention. Any news that can be taken as bullish would surely spark a big rally right now.
Its little brother HO Heating Oil gave us an original 0.76 or 3/4 cent STOP GTC last Thursday evening. We had to contract that small stop even smaller and were stopped out Monday afternoon with less loss. The original low close (141.10) is still intact, as is the original LOWPRICE ;@ 140.32.
Here’s the REAL QUESTION: Since MRI Trading Signals identified a HO BUY trade with an original 0.76 sized STOP GTC and then contracts it a trading day later and Monday’s MRI 3D Report identifies a CL BUY trade with 25 cent STOP GTC: WHAT is our REAL RISK to REWARD on these kind of stand alone powerful multiple Time Frame TIME signals and TIME and PRICE signals? Not much RISK with a very favorable Risk/Reward ratio. These are the kind of signals that can produce “home runs”. Just keep in mind- the winning percentage isn’t as high as our “meat and potato” trades, because the BEARS don’t want THIS TYPE of trade to sprout wings and fly north because those traders “in the know” realize how small the original risk was! (44.20 STOP GTC)
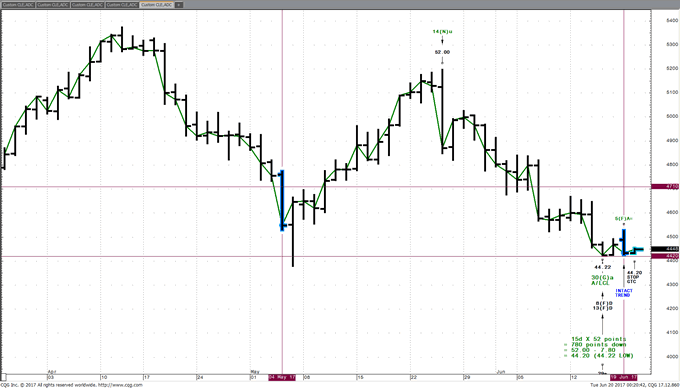
Take a good look at the following WEEKLY charts and see for yourself. In review, see how the Week of 08 FEB 2016 Secular LOW CLOSEwas identified with 2 separate LCL (Logarithmic Closing Line extensions), 1.00 LCL EXT X 07 JUL- 22 NOV 2008 FROM 25 APR 2011plus 3.618 LCL EXT x 25 APR-26 SEP 2011 FROM 02 SEP 2013.
The following major LOW WK of 01 AUG’16, presented in PRICE, a WAVE LOG 3/8 x 08 FEB-23 MAY, EXCL “higher b” (06 JUN), then followed 6 weeks later by a FRACTAL LOG 5/8 in the WEEK of 12 SEP.
The following major HIGH in the WEEK 17 OCT’16 was a minor 1.00 ACL EXT x 25 JUL-15 AUG FROM 12 SEP, in combination with TIME; 36(N)u/08 FEB secular LOW and 76(L)a/04 MAY’15 TOP.
The following major LOW WEEK was a AR/LOG TIME EQUALITY 40A=/08 FEB secular low.
The following HIGHEST WEEKLY CLOSE was A/LCL 22(N)u in the WEEK 27 DEC. The next week saw the 2017 HIGH in the WEEK 03 JAN as 1.00 AR EXT x 01 AUG- 17 OCT’16 FROM 14 NOV’16.
See the next major TOP WEEK 20 FEB with TIME presenting A/LCL 3A=, 15A=, 30(G)u, and 54U, being 0.618 X 87Weeks down.
See the next major LOW WEEK 20 MAR, a “lower b(b)”, is A/LCL/AR/LOG 58(N)a/08 FEB secular LOW.
Which concludes with last week’s 12 JUN 3D=, 6A=, 30(G)a/14 NOV LOW and 45(G)/01 AUG LOW
CRUDE seems to be expending a “great deal of effort” in THIS bottom area since last Thursday’s HO bottom. It would appear last week was a MAJOR LOW WEEK to spark a BEAR MARKET RALLY over the next several weeks. It looks very likely the 2016 HIGH is in the 1st WEEK 03 JAN with the 1.00 AR EXT.
WHEN MRI 3D is identified, as long as the market derived RISK is only 1 % to 3% of our hypothetical $30,000 trading account we have something really worth trading.
If you liked the content of this article you may appreciate the MRI 3D Report is turnkey and there’s no guesswork, including GTC STOP management. We release our MRI 3D trading intelligence between 5:30 pm E and usually by 9:30 pm E, no later than 10:30 pm E, with an EMAIL ALERT.
Only MRI Trading Signals offers a performance minimum (6%+) in your 30 days subscription or MRI refunds the membership fee. Visit us, see our video, view many more charts like these and subscribe to the MRI 3D Report today.
Witten and published by Stephen Cox, founder of MRI Trading Signals and developer of MRI 3D TIME PRICE analysis within DEPTH of 4 Chart Frames- 3 of them beyond the arithmetic bar chart finding > 70 % of signals invisible to everyone else.
Video Introduction - https://mritradingsignals.com/the-science-of-mri-3d/
MRI Trading Signals Home Page - https://mritradingsignals.com/
Stephen Cox
Stephen Cox is a 4 decade trader and analyst who first started teaching his TIME and PRICE methods in 1989. MRI 3D is the culmination of his work in Time, Price and the 3rd dimension DEPTH. The MRI Trading Signals Subscription is purely performance based. The only way we keep our fee is by delivering 6%+ return in our hypothetical account, during the 30 Days subscription.
© 2017 Copyright Stephen Cox - All Rights Reserved Disclaimer: This is an paid advertorial. The above is a matter of opinion provided for general information purposes only and is not intended as investment advice. Information and analysis above are derived from sources and utilising methods believed to be reliable, but we cannot accept responsibility for any losses you may incur as a result of this analysis. Individuals should consult with their personal financial advisors.
© 2005-2022 http://www.MarketOracle.co.uk - The Market Oracle is a FREE Daily Financial Markets Analysis & Forecasting online publication.