


3 Global Financial Markets That Could Indicate an Interim Correction
Stock-Markets / Financial Markets 2017 Dec 01, 2017 - 04:22 PM GMTBy: Gary_Tanashian

 Here are a few global ETFs with little room to drop in order to avoid daily chart technical breakdowns. That does not mean the end of the larger up trends, but could signal oncoming intermediate corrections if they do fall further and close the week that way (pre-market is red). The question would be, are they leading the fiscally drunk US market and its chronic tweeter in chief/stock pumper?
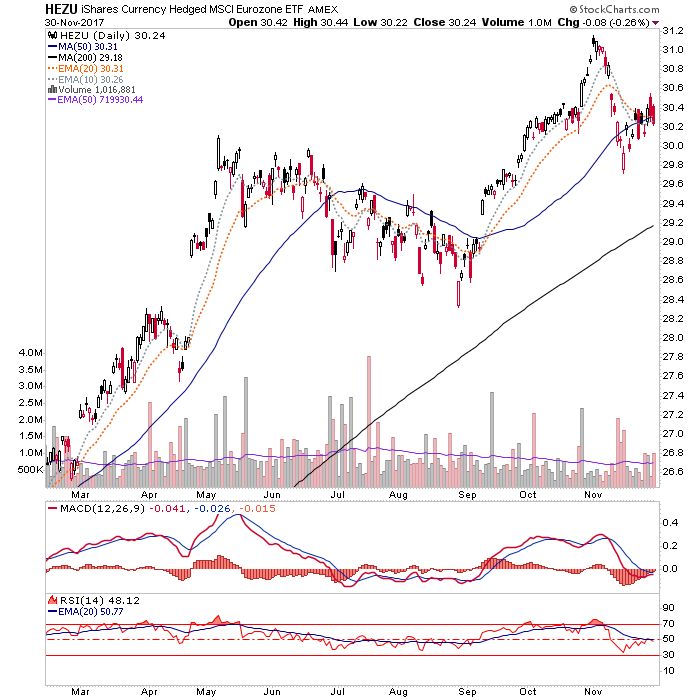
The Euro hedged European iShares, like the Euro STOXX 50 which it mimics, is in a bear flag. The biggest volume days have been red as this flag has ground upward. Not a short-term bullish look for Europe. What it does have going for it is that the SMAs 50 & 200 are both sloping upward. Even a hit of the 200 is within the context of the up trend.
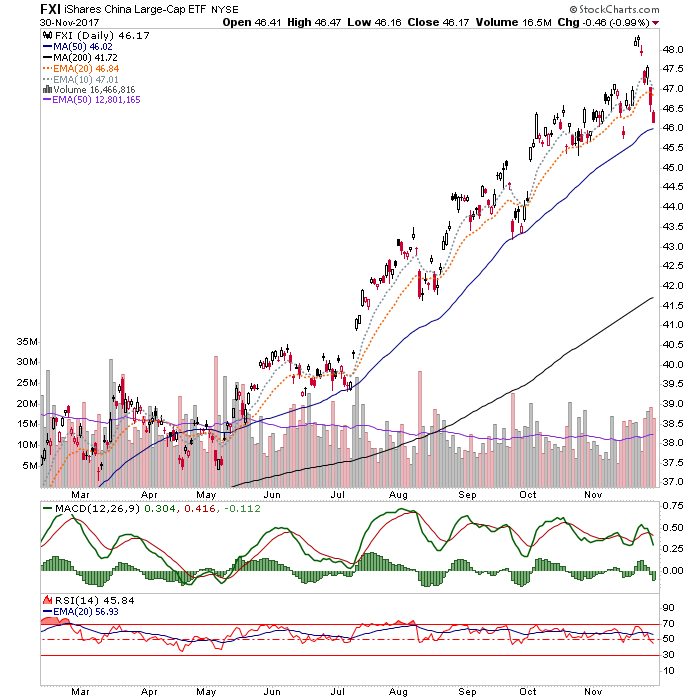
China 50 has been an absolute robot in its orderly up trend. The pullbacks have been to the SMA 50 and today, close on the heels of the last one a hard drop to the SMA 50 after a silly gap up is in play. This is a suspect for no other reason than that gap up looks like a classic bull trap. Speaking of which, what about the US Dow & SPX yesterday, eh Bueller? Anyway, it’s a long way down to the firmly up trending SMA 200 if FXI were to lose the 45 area.
EMs? See above.
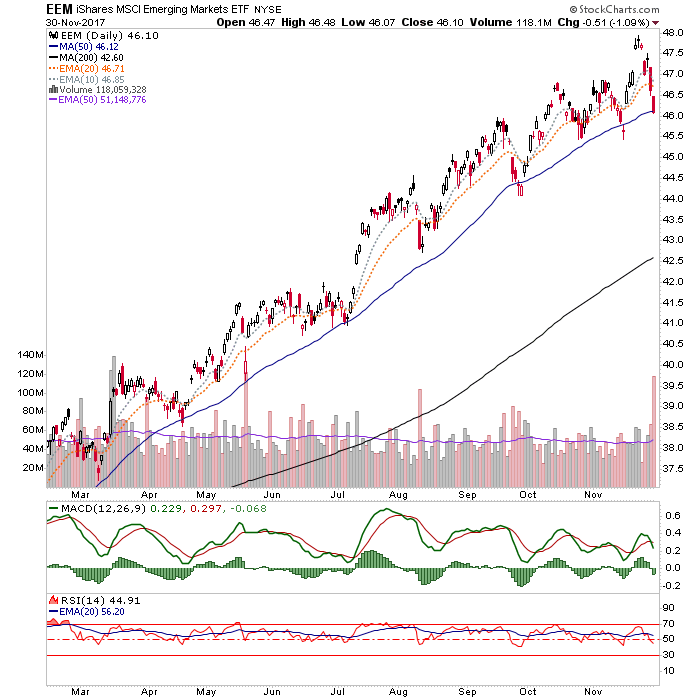
Sure, the US is drunk on tax cuts for the wealthy and corporations. That’s market friendly… whee! But it is unlikely that the richly valued US market would pull a flying pig routine in the face of a global pullback. So it may worthwhile to watch Europe and two recent global leaders, China (large caps) and EM for indications.
The slow moving big picture plan per yesterday’s post would not be affected (other than the short-term state of it’s 10yr/30yr yield view if risk goes off and bonds get bid) unless a pullback, if it comes, were to start breaking major markers, like the daily SMA 200 and lateral support levels (which we’d manage as needed). This post is not predicting a correction, but it’s giving us one element to watch in support of a case for one. Let’s see how the week ends for global stocks.
Subscribe to NFTRH Premium for your 40-55 page weekly report, interim updates and NFTRH+ chart and trade ideas or the free eLetter for an introduction to our work. Or simply keep up to date with plenty of public content at NFTRH.com and Biiwii.com. Also, you can follow via Twitter ;@BiiwiiNFTRH, StockTwits, RSS or sign up to receive posts directly by email (right sidebar).
By Gary Tanashian
© 2017 Copyright Gary Tanashian - All Rights Reserved
Disclaimer: The above is a matter of opinion provided for general information purposes only and is not intended as investment advice. Information and analysis above are derived from sources and utilising methods believed to be reliable, but we cannot accept responsibility for any losses you may incur as a result of this analysis. Individuals should consult with their personal financial advisors.
Gary Tanashian Archive |
© 2005-2022 http://www.MarketOracle.co.uk - The Market Oracle is a FREE Daily Financial Markets Analysis & Forecasting online publication.