


US Stock Markets Living In A Bubble
Stock-Markets / Stock Markets 2018 Jan 28, 2018 - 05:14 PM GMTBy: WMA

 Signs that U.S. equities are in a bubble continue to proliferate. Although a bubble can only be confirmed in retrospect, prudent investors need to adjust their investment approach for this eventuality.
It is said that the earlier you buy in a bubble, the better off you’ll be when the bubble bursts. Or, an investor could simply just avoid buying the assets in a bubble all together. The latter option makes more sense to us today. This implies not doing buy & hold investments in the popular indexes (Dow, S&P 500, Nasdaq-100) heavily weighted in assets that are among the most crowded trades on the planet: Boeing, Caterpillar, 3M, Amazon, Microsoft, Google, etc. As investors, all of our strategy portfolios are oriented towards relatively attractive foreign companies and resources stocks. For traders (or investors who can’t stand watching the equity markets advance without them), beware of sharp pull-backs. A bubble market does not back-up to give outsiders a nice opportunity to get onboard. Getting a -3% dip on the S&P 500 at this stage probably has more chance of being the beginning of a downdraft rather than a buy-the-dip opportunity.
In this week’s Commentary, we gathered several elements that argue in favor of an on-going bubble in U.S. equities.
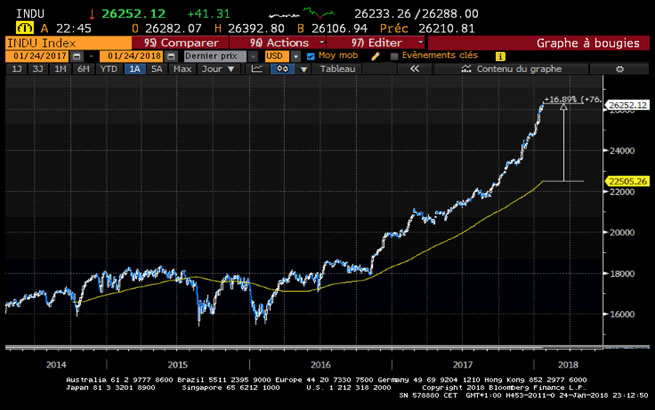
The Dow Jones Industrial Average, perhaps the leading candidate for being in a bubble, is now about +17% above its above 200 day moving average. You’d need to look all the way back to 1999 when the Dow managed to get +22% above its 200-day moving average. From that point in 1999, the index only climbed +6% higher in 2000 before hitting its ultimate peak.
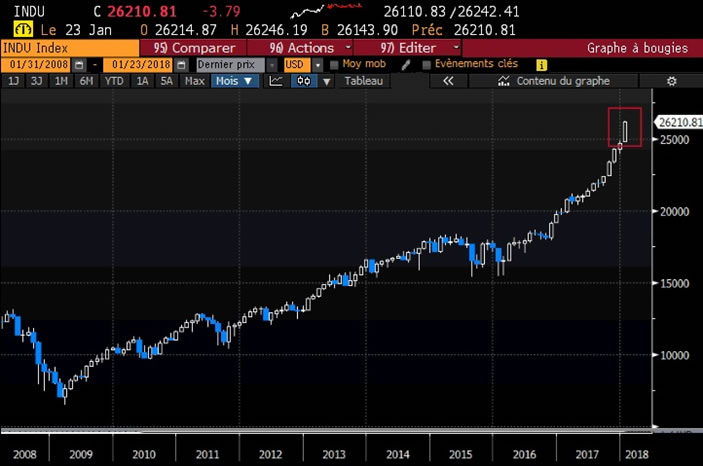
In euphoria, the buying gets more panicked as the rally progresses. Below is a monthly candlestick chart of the Dow. Notice that the bars are getting longer in the past months, with January’s bar being the longest, signifying the most extreme buying pressure.
In terms of records, today’s market is re-writing the record book. To find the last date the Dow finished a session down over -1%, you’d need to go back to September 5, 2017 – almost 5 months without a real down day! The streak of days without a -5% peak to trough pull-back in the Dow is now at 398 days, surpassing the previous record of 394 days between 1994-1996 and setting an all-time record for the venerable 120-year old index. While some may argue that a market that does not correct is a sign of strength, a one-way market of this magnitude is probably not healthy. It is the ebb-and-flow in an up-trend that makes a market move sustainable. We are more likely in a boom-and-bust cycles – all in, then all out.
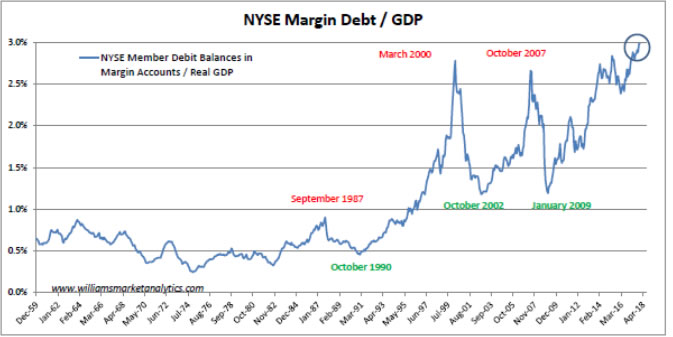
Margin debt also characterizes bubbles. Our margin debt-to-GDP ratio is now at 3%, an all-time high -- even surpassing the Tech Bubble highs.
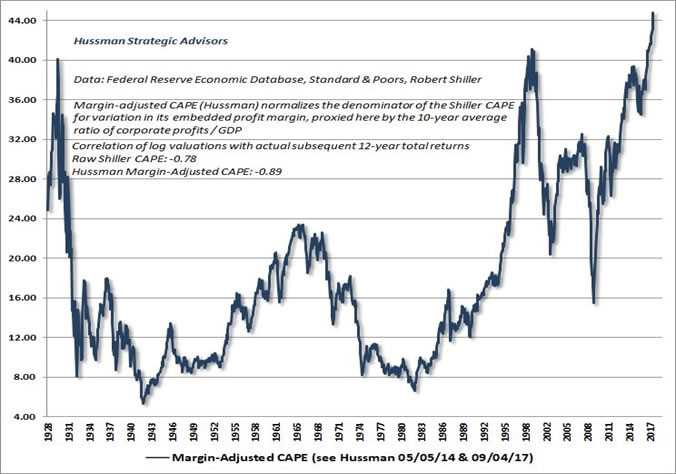
John Hussman did the chart below which modifies the traditional Shiller CAPE P/E (cyclically-adjusted price/earnings ratio) to account for use of margin debt in the markets. Today’s P/E’s based on this measure surpass significantly both the 1929 and 2000 market top valuation levels.
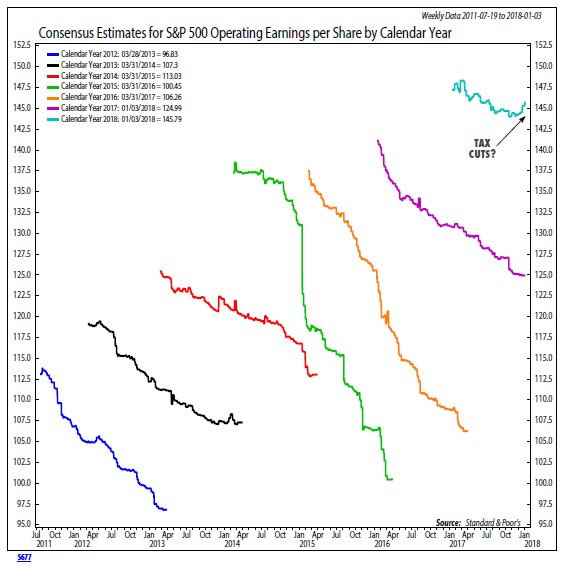
It would also appear that investors are viewing companies with rose-colored glasses, as always happens at market tops. At first blush, tech stocks may not seem that expensive, for example. The average price/earnings ratio for tech stocks in the S&P 500 index is around 22, based on projected earnings over the next 12 months. That’s more than a third more expensive than the 10-year average P/E for the sector as a whole—pricey, to be sure, but not at Tech Bubble levels. The problem is that Wall Street analysts are an optimistic bunch. Just wait for the downward earnings revisions in 2018 to get a more accurate measure of company valuations. Below is the track record of earnings revisions throughout each year since 2012. Do you want to bet 2018 is different and that analysts won’t revise down today’s very optimistic earnings forecasts?
Anecdotal evidence shows that Retail Investors (typically the followers) are suddenly rushing to buy. Following eight years of net outflows, they poured nearly $80 billion into mutual funds and exchange-traded funds in the postelection rally. In 2017, however, corporate insiders had been selling at the fastest pace in nearly 30 years.
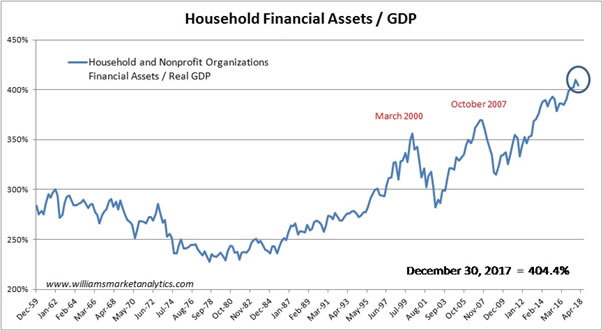
Households now have “over-ownership” of equity investments. Their exposure to the stock market relative to real GDP is 49% above the 30-year norm and well above the prior two bull market peaks.
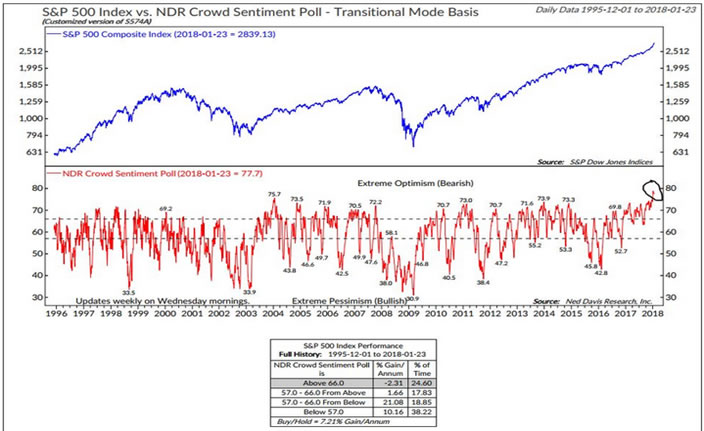
We are also seeing sentiment indicators hit cyclical and record highs. Ned Davis’ Crowd Sentiment Poll hit a record since 1996. Extreme readings don’t coincide perfectly with a high in equities, but extreme high readings do tend to imply that the equity rally is living on borrowed time. Our own WMA Sentiment Indicator is at the highest level since 2014, after which the S&P 500 entered a two-year horizontal trading range.
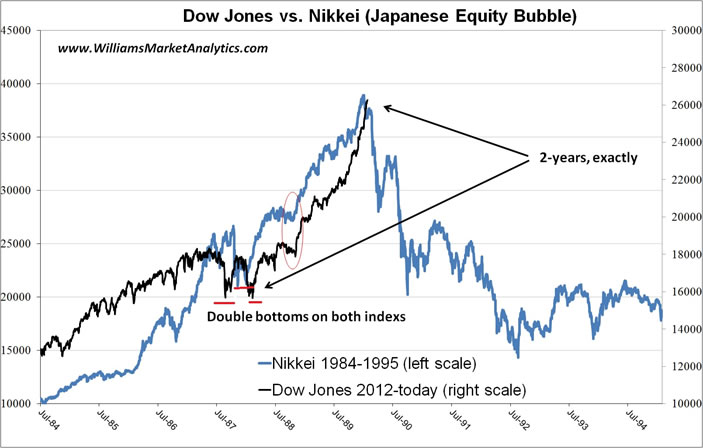
To conclude, simply looking at a multi-year chart of the Dow could lead one to conclude that index is in a bubble. We created an overlay chart of the Dow vs. the Nikkei around the peak in the Japanese equity bubble of the late 1980s (first chart below). The second chart below is the Dow. The third chart is the Nikkei from 1984 to the bubble peak in Japanese equities in 1990.
Note the similarities:
- The Nikkei corrected in late 1987 and formed a double bottom that launched the final run. The Dow corrected in early 2016 and formed a double bottom that launched the (perhaps) final run.
- The move from the correction in the Nikkei to the index peak lasted two years. The move in the Dow from its last correction to today is now exactly two years.
- After the initial spurt, the Nikkei paused a few months in the middle of the two year run. The Dow paused from March to June 2017.
- The Nikkei bubble ended with a final run that went straight up nearly 10%. The recent run in the Dow has been straight up and has added 11%.
We are not insinuating that the Dow bubble will play out just as the Japanese equity bubble, but these similarities are astounding. Past will not likely be prologue for the Dow, but on the Nikkei, the initial move down occurred over 10 days and cost the index -5.5% (including a fake-out rally day). After almost 3 weeks of consolidation below the bubble peak, the bottom dropped out and the Nikkei lost -26% in just over a months’ time.
As mentioned above, our take-away message is that if we get a -5% drop in the Dow, it’s more like time to be extra vigilant and not to be looking to add to equity positions.
By Williams Market Analytics
http://www.williamsmarketanalytics.com
We provide insightful market analysis and account management founded upon our very successful systematic, disciplined approach to investing. Our investment analysis revolves around two inputs: company valuation and our quantitative, market-based indicators. Learn more about our approach and our strategist.
© 2018 Copyright Williams Market Analytics - All Rights Reserved
Disclaimer: The above is a matter of opinion provided for general information purposes only and is not intended as investment advice. Information and analysis above are derived from sources and utilising methods believed to be reliable, but we cannot accept responsibility for any losses you may incur as a result of this analysis. Individuals should consult with their personal financial advisors.
© 2005-2022 http://www.MarketOracle.co.uk - The Market Oracle is a FREE Daily Financial Markets Analysis & Forecasting online publication.