


US Stock Market, Gold, Silver and the Macro Backdrop
Stock-Markets / Financial Markets 2018 Feb 11, 2018 - 07:17 AM GMTBy: Gary_Tanashian

 US Stock Market
We will update global markets as well as the macro situation in NFTRH 486, but for this article I’d like to focus on the US stock market.
Let’s cut to the chase; the markets have finally fallen in line for those of us who manage markets, as opposed to dollar cost average into them through a money manager and then go about life, blissfully unaware. Much like during the 2015-2016 period, when the media were all but demanding investors go one way when the right way was the opposite (for example, we got bullish during the Brexit mini hysteria because sentiment, macro indicators and charts told us to) during the market top (that wasn’t).
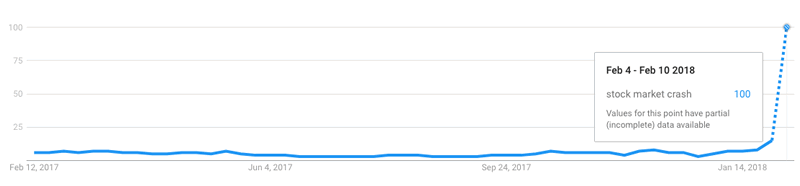
But today the bliss is wearing off as the average person did not need to wait for his monthly statement to see that something went wrong with the up-melting market that was printing him money every month. Here is a look at the Google Trend for the search term “stock market crash”. Per Google’s computation method, the reading cannot go higher than 100.
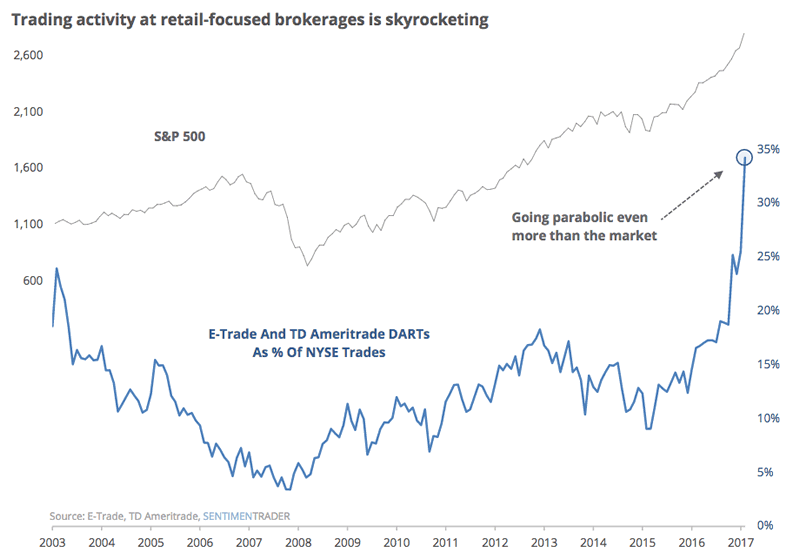
It’s a good bet that much of the new money, the ‘all-in and ready to make coin’ retail money summoned by the now-fiscally unrestrained economy and wooed by Donald Trump’s relentless stock cheer leading on Twitter, was pounding away at keyboards searching for what went wrong as well. Our handy graphic (courtesy of Sentimentrader) once again makes the point of who exactly got sucked in and likely, flushed.
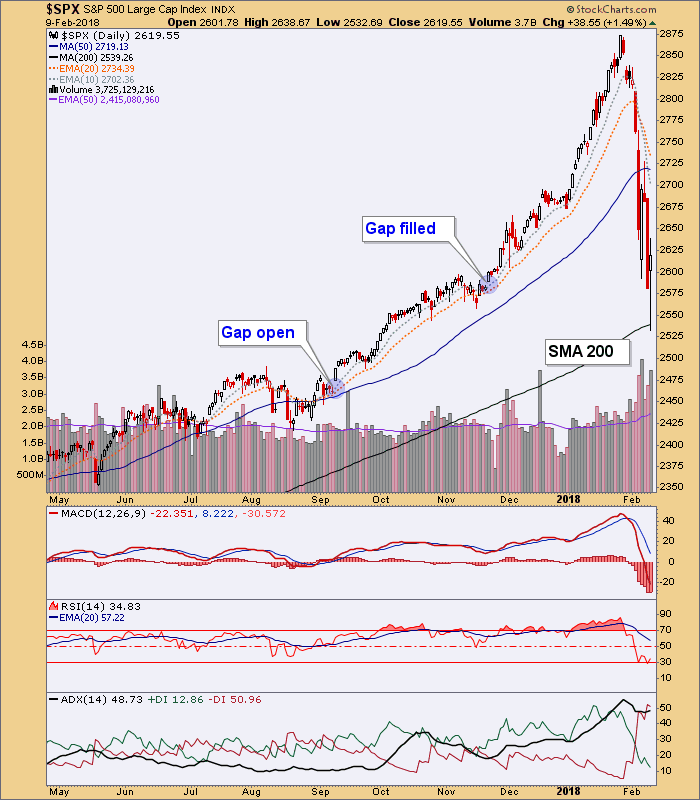
But then came the relief on Friday, just as we had suspected earlier in the day when everything was red as a far as the eye could see. The linked post included a chart of the S&P 500, down another 1.4%, filling a gap and kissing the SMA 200. From the post…
Okay, a little play-by-play sports fans. I covered another short (on SOXL) and still have the bullish feelings (short-term only at this point) welling up within me. Can SPX go for the lower gap all in one big gulp? Well let me ask you this; how vigorously, how constantly, how emphatically did the president of the United States pump this market’s tires? I really do think this melt-down is emblematic of that asininery and it is doing a fine job of neutering it. Sure, it can go for that gap.
But SPX is at the SMA 200, sentiment is changing in a big way and I think the point has been made to any and all who had lapped up the jingoistic bullshit coming out of the White House.
I hesitate to write in a seedy newsletter writer style of ‘my subscribers were warned in advance and were kept out of harm’s way and ready to take advantage’ because I give NFTRH subcribers much more credit than that. They are not “my” subscribers. I am their market manager trying his best to help keep us all on the right side of the market’s probabilities.
Here is the current chart from that update. I did not wait for the rebound. I covered shorts when the market was red and then started adding long positions as SPX ground the SMA 200 and looked to hold it. All of this per the NFTRH Trade Log, which subscribers have access to but are encouraged to use for reference only, as I am no better than the next guy when it comes to daily trading. What I am good at is gauging charts and macro signals and then trying to allocate in accordance with them.
This weekly chart was created a few weeks ago for NFTRH’s Market Sentiment segment in order to make a visual point about the market’s post-Brexit history. In the post linked above a gap around 2460 is noted. The market held a small shelf of support at the SMA 200, but we are not out of the woods for the correction, folks. The up-melting trend has been killed and months of building hysteria are being addressed. The market’s long-term trends are fully intact however, so we can keep an open mind as to whether the long-term answer is bullish or bearish.
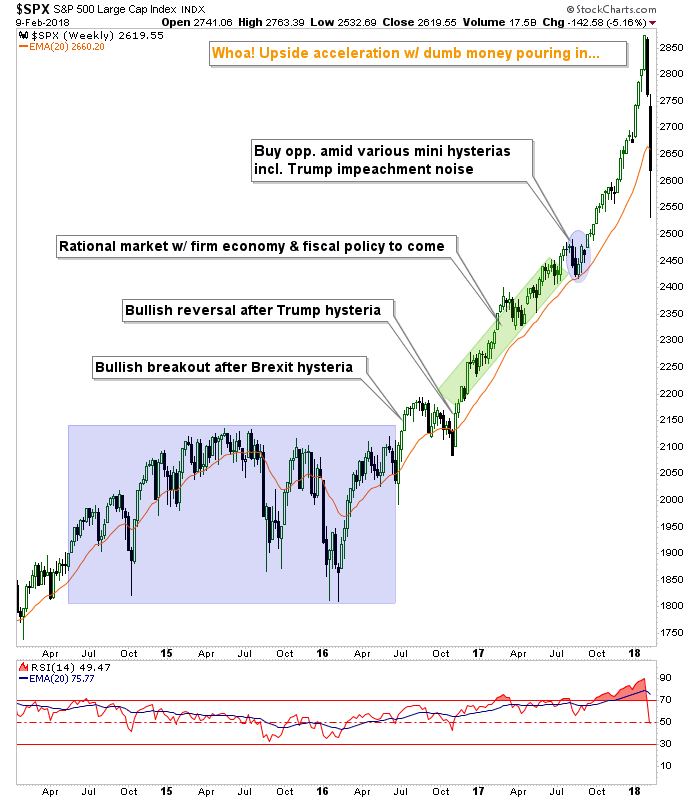
In a nod to the bear case, the above chart looks like another from recent history. That was silver in the spring of 2011, melting upward amid much hysteria about long-term interest rates and inflation (sound familiar?). So let’s at least acknowledge that when tuning out everything we think we know, a harsh break in a market after an extended, story-filled melt up has precedence as a bull ender. After covering all short positions I am long the market with a high level of dividend-paying cash equivalents (SHV, see Stupid Cash Holders) and some Treasury bonds. But the long orientation is likely a very temporary condition as I plan to manage the hell out of this event going forward. In short, the market is fun again because hard work done is being rewarded. Dart throwers are no longer rewarded.
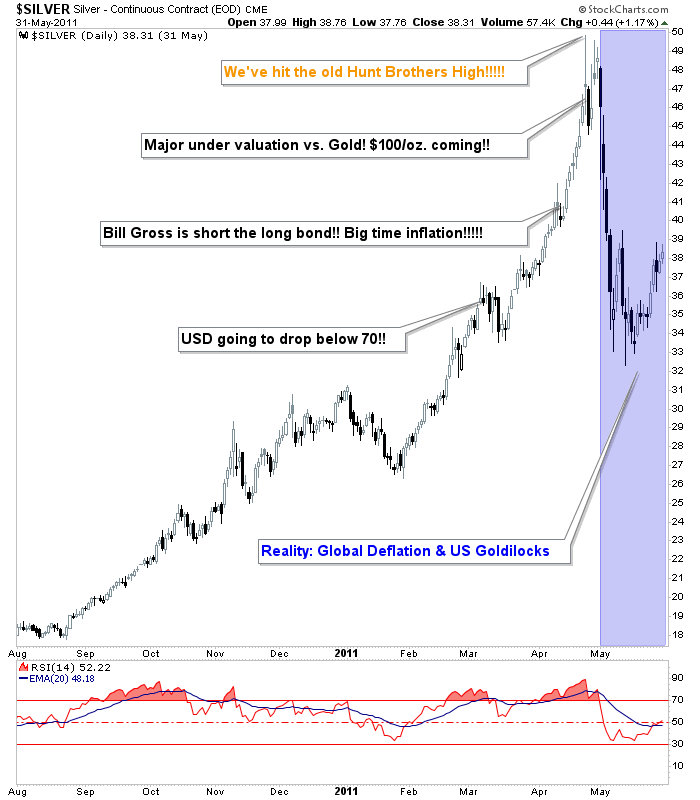
The historical silver chart is a handy segue into a few words on the precious metals, which we have maintained are “in the mirror” to or left on the outside looking in at the party that has been going on in US and global stocks and the various macro risk ‘on’ trades.
Precious Metals
We have been very actively managing this sector lately, from the ‘buy’ in mid-December for seasonal, sentiment and CoT reasons (the latest CoT data moved positive, with silver especially near a turning point) and as a part of an ‘inflation trade’. But that is not the real reason to be bullish the sector (see beware the inflationists). The real reason to be bullish the gold sector is when things fall apart and gold’s ratios to positive cyclical items like stocks, oil, industrial metals, etc. rise.
So you see, the fate of the risk ‘on’ stock market and relatively risk ‘on’ commodities and ‘inflation trade’, now being promoted once again using Bill Gross (along with fellow superstar Ray Dalio) feeds directly into the fate of the counter-cyclical gold sector. Ladies and Gentlemen, below once again, is our visual presentation in planetary form (because I like looking at it).
The important issues will be for gold to out perform stocks (was last week the first crack?), the economy to show signs of exhaustion (we are tracking a very sensitive indicator in NFTRH, which had a side benefit of alerting us to the coming trouble in the stock market even though I was using it as an economic indicator). By extension, confidence in the fiscally stimulated economy would eventually begin to erode, the flattening yield curve (noted as yield spreads on the graphic) would grind out a low and steepen, gold and silver (monetary & relatively monetary, respectively) would trounce cyclical commodities and so on…
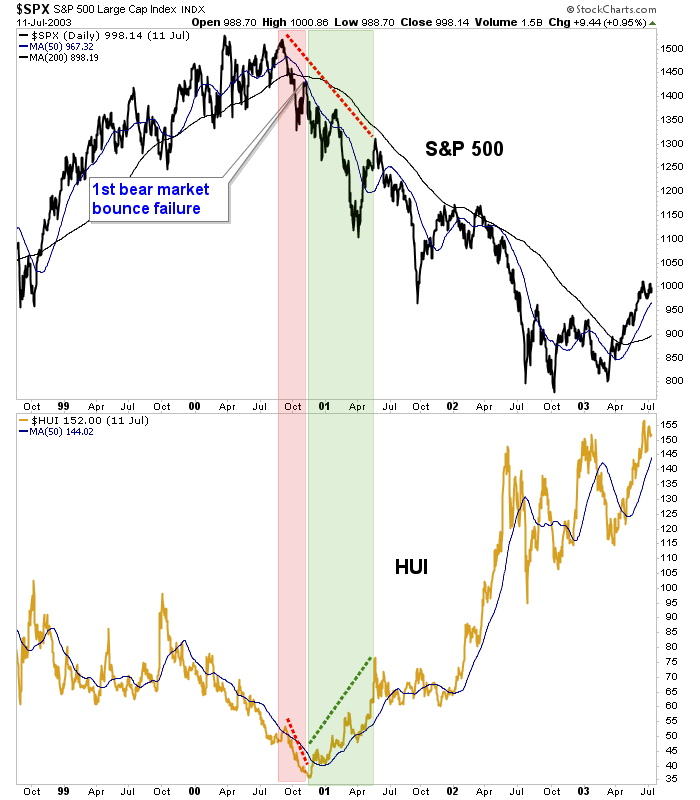
While the detailed work is reserved for NFTRH Premium (we are managing a potential near-term low that will have flushed the inflationists), let’s take a look at a few constructive big pictures, which would become more than constructive if the stock market enters a bear market as was the case in 2001.
While the current stock market situation is much different from 2001 (a manic melt-up and break vs. a more traditional top) the theory is the same. The gold sector made its final bottom as the S&P 500 made its first ill-fated bounce of what would unfold into a bear market. Does history repeat exactly? No. Does it often rhyme? Oh yes.
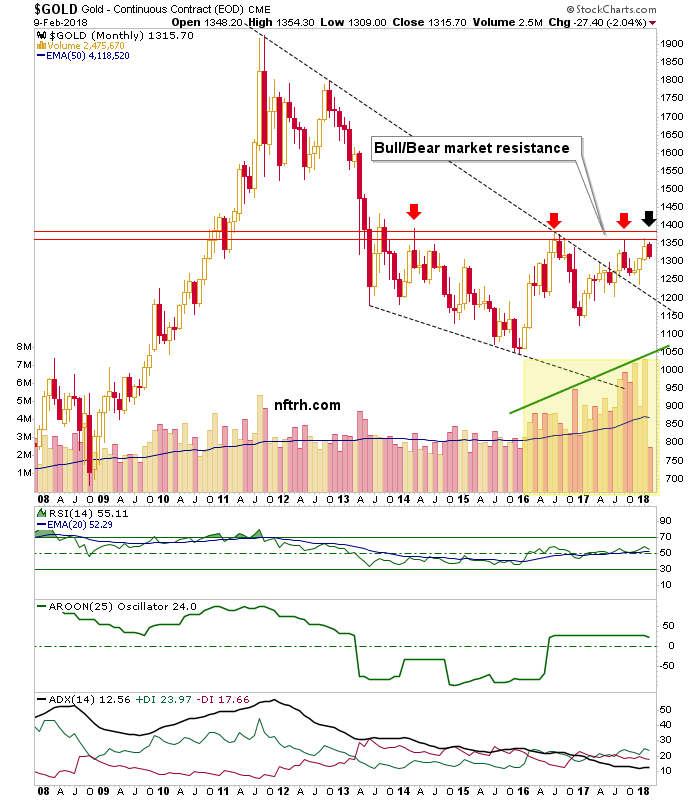
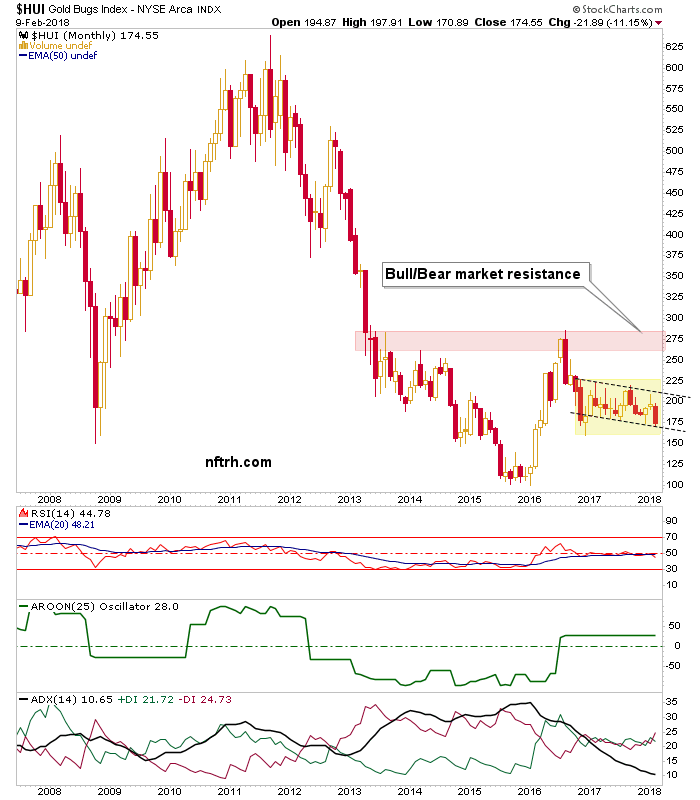
Finally, big picture monthly charts of gold, silver and HUI that have kept us constructive on the sector pending all the post-2016 whipsaws.
Gold is knocking at the door of a new bull market, but we have noted that this will not come easily and it surely hasn’t. What the chart has going for it is rising volume interest, gently positive RSI, a positive AROON trend and a completely flattened out downtrend and fledgling upturn by ADX and its +DI above -DI. Another positive is the simple fact that the more times resistance is attacked by price, the weaker it tends to become. Gold is taking its 4th crack at it.
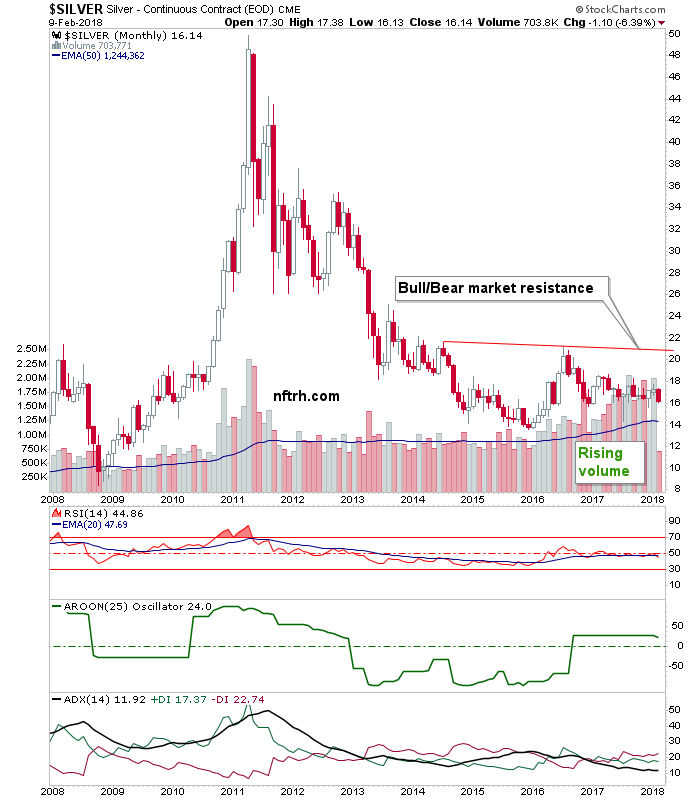
Silver has been in lock down vs. gold. But it can still be viewed as a leader in waiting for the precious metals, especially given its relatively positive CoT structure. RSI is just negative below 50, AROON is positive and ADX shows an exhausted downtrend, although -DI is still above +DI.
The real story of this chart, which shows the rest of the sorry post-bubble history from the 2011 chart above, is an extended bear market, sharp upturn in 2016 and what seems like a forever consolidation of that upturn. I can assure you it will not be forever. If this is a prelude to a bullish resolution the job of this consolidation will have been to grind away at the spirits of every last player who got bullish in 2016, thinking it was a new bull market (which it may well have been).
HUI is similar. The upward burst in 2016 has been ground away at for 1.5 years now. The former downtrend is completely eliminated but there is no sign yet of a new upturn.
Which brings us back around to the beginning of the article. Is the macro shifting per our 3 Amigos indicators (SPX vs. gold, long-term interest rates to their decades-old limiters and the end of the yield curve’s flattening)? The fate of the S&P 500, now bouncing as expected, will directly inform the view of the counter-cyclical gold sector.
Whether the resolution to the broad market is to be bullish or bearish, it is going to take active management and updating of macro indicators all along the way to said resolution. NFTRH stands ready and engaged, as I have not seen the likes of this phase since 2015, which was a time to separate the wheat from the chaff where market strategy is concerned.
Subscribe to NFTRH Premium for your 40-55 page weekly report, interim updates and NFTRH+ chart and trade ideas or the free eLetter for an introduction to our work. Or simply keep up to date with plenty of public content at NFTRH.com and Biiwii.com. Also, you can follow via Twitter ;@BiiwiiNFTRH, StockTwits, RSS or sign up to receive posts directly by email (right sidebar).
By Gary Tanashian
© 2018 Copyright Gary Tanashian - All Rights Reserved
Disclaimer: The above is a matter of opinion provided for general information purposes only and is not intended as investment advice. Information and analysis above are derived from sources and utilising methods believed to be reliable, but we cannot accept responsibility for any losses you may incur as a result of this analysis. Individuals should consult with their personal financial advisors.
Gary Tanashian Archive |
© 2005-2022 http://www.MarketOracle.co.uk - The Market Oracle is a FREE Daily Financial Markets Analysis & Forecasting online publication.