


Is the Stock Market Correction Over?
Stock-Markets / Stock Markets 2018 Feb 12, 2018 - 06:58 AM GMTBy: Andre_Gratian

 Current Position of the Market
SPX: Long-term trend – The bull market is continuing with a top expected in the low 3000s.
Intermediate trend – An intermediate correction from 2872 is currently underway.
Analysis of the short-term trend is done on a daily basis with the help of hourly charts. It is an important adjunct to the analysis of daily and weekly charts which discusses the course of longer market trends.
Daily market analysis of the short term trend is reserved for subscribers. If you would like to sign up for a FREE 4-week trial period of daily comments, please let me know at ajg@cybertrails.com
Is the Correction over?
Market Overview
This is something that will be determined next week. There is a cycle bottoming early in the week and another on the following Monday. It’s a question of which one will be the most dominant. In order to make the analysis more clear, we’ll go directly to the weekly SPX chart.
Chart Analysis (These charts and subsequent ones courtesy of QCharts)
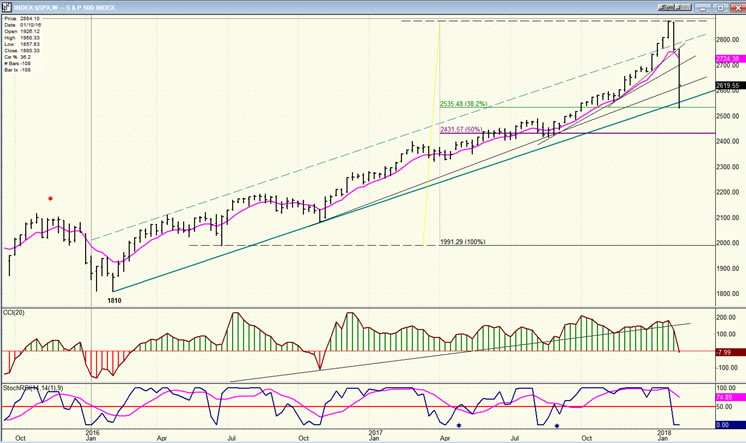
SPX weekly chart
The decline which started from 2872 had a brief pause at 2600 and found more solid support when it reached the intermediate trend line from 1810. That price level (2533) also represented a .382 retracement of the uptrend from 2000, which is the phase that we are currently correcting. So, are we done? And are we now ready to resume our uptrend? Probably not; or at least, not without retesting the 2533 low. It is also possible that we will extend the correction to a .50 retracement (down to 2434) by the following Monday; or perhaps by next month when another important cycle is due to make its low. In fact, we may not be able to attempt going for a new high (which is still the preferred scenario) until after the next 40wk cycle makes its low in May.
For now, let’s concern ourselves with near-term activity to see if we can hold at our current low of 2533 for the next few days.
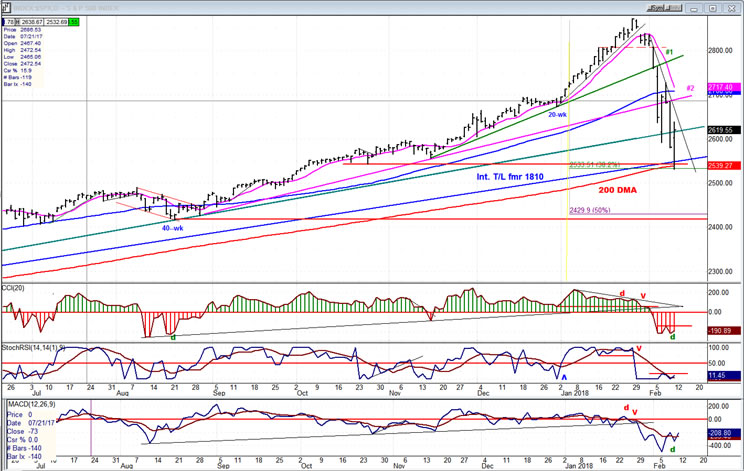
SPX daily chart
Analyzing the daily chart will provide more details not available on the weekly chart. Right away, we can see why SPX found firm support at 2533. Besides the intermediate trend line and a .382 retracement, the index had previously held this level in October and, more importantly, this is the current level of the 200-DMA. It would have been disastrous if the index sliced through all that support without at least bouncing. Collectively, these various factors improve the odds that all we’ll do is re-test this level next week before moving beyond the bounce high of 2638. But this will have to be confirmed! The conditions necessary to extend the rally immediately are clearly lacking. The chart shows no price deceleration, and the steep downtrend line has not even been tested. There was some positive divergence showing in the oscillators at the low of the move, but more work will have to be done before they can signal that a reversal is about to take place.
A test of the low which takes two or three days (as the next 10-day cycle bottoms) would help create a base and get the oscillators ready for a buy signal, but this will not be enough time to form a congestion pattern which would be large enough to allow SPX to make a new high. Perhaps preparation will need to extend into March. Then we may have to wait until the 40-week cycle makes its low in May before such an attempt can be made. In other words, the kind of weakness that we have just witnessed should require a healing period before the index is well enough to attempt climbing to a new high -- which is still the preferred scenario for completing the structure which started at 1810.
In the meantime, the risk of making a new low first, either right away or into the 40-week cycle bottom (or both) is very real. Near-term, if the next cycle turns out to be dominant, we could drop down to 2410 over the next week. In fact, while this is not a guarantee, the congestion pattern which was formed around the 2650 level on the P&F chart does carry such a count. So what happens over the next few days will be telling. If the volatility of the past week does not subside, it will not be difficult for the index to drop another 150 points over the next week.
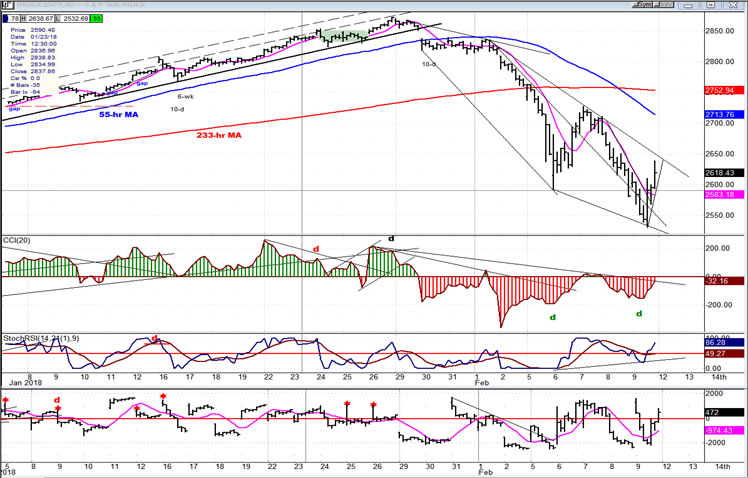
SPX hourly chart:
It did not take long, last Monday, for SPX to announce that it was not going to stop at the 233-hr MA. After breaking it, it did try to rally back above, but it was a futile attempt and it was all downhill after that. The decline accelerated into a vertical descent of larger, hourly segments until it found initial support at the top of a former congestion pattern and quickly built a base which had the potential of moving it back to 2780. But it failed to get even close to that target and started back down in a steady stream of hourly, lower highs and lower lows until it had retraced .382 of the phase under correction. This brought a three-hour, 100+-point rally which pulled back 26 points in the last 7 minutes of trading on Friday. Even the final stages of the 7-year cycle in 2016 which created the 1810 low looked tame compared to last week’s volatility!
For all of that one hundred+-point rally on Friday, the A/Ds could only close at a 472 differential, and the hourly CCI could not even get back into the green -- with the daily indicator looking much worse. Under normal circumstances, these indicator readings would not immediately call for a sustained rally, but rather, at a minimum, a retest of the low with considerably diminished volatility. But these are not normal circumstances, so we’ll just have to see what transpires over the next five days.
An overview of some important indexes (weekly charts)
All of the indexes have, naturally, been affected by the correction and, judging by their charts and indicators, it’s not over. This would seem to support the view that the market correction is not over either. We do not know what form it will take, and we will just need to study the data for clues as we move forward.
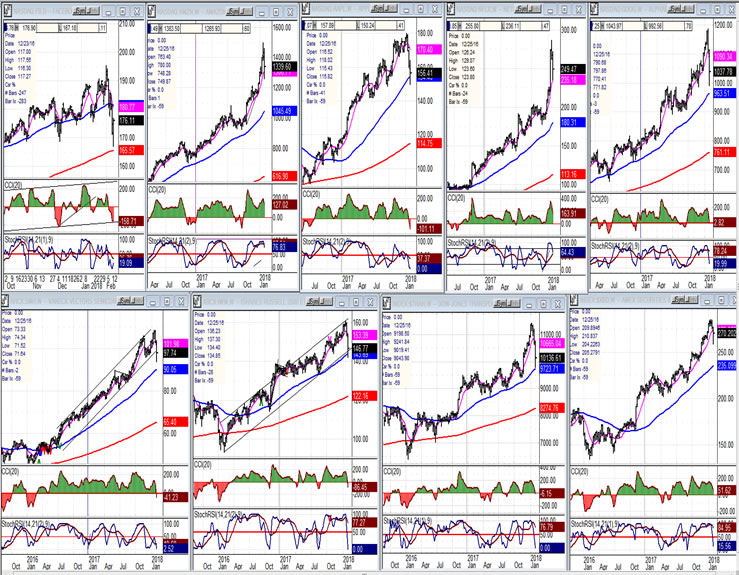
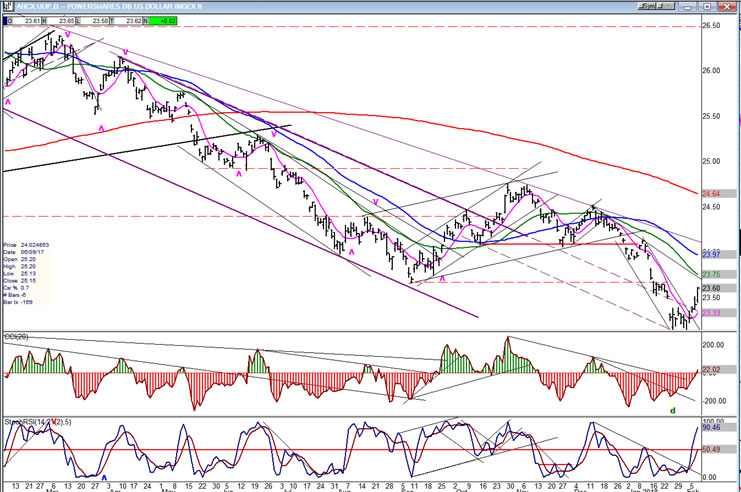
UUP (dollar ETF)
UUP’s rally was expected and it fits best as a wave 4 of the second correction phase which started from 24.75. If so, it will be of limited extent, but could continue as a sideways pattern for a while longer before resuming its decline toward a slightly lower low. However, the longer-term picture calls for much lower prices if the P&F chart is to be believed.
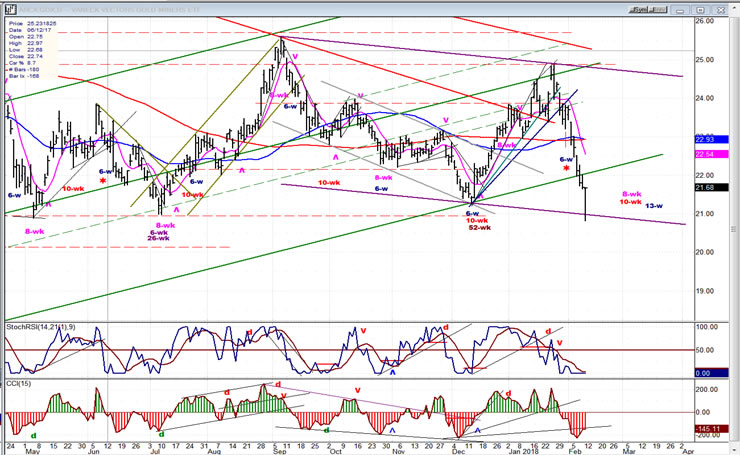
GDX (Gold miners ETF)
GDX has disappointed its bullish followers by pulling back much deeper than had been anticipated. In retrospect, this is attributable to a failed 6-wk cycle which only produced an upside blip before the price continued to decline. I have marked with a red asterisk the 06/13/17 date, where the same thing apparently happened.
GDX appears to observe its trend and channel lines with precision and, on Friday, it bounced off a bottom channel line which delineates the corrective pattern from 09/08/17. It is likely that this correction will continue into the cycle-lows cluster which lies ahead, and that will bring it to the early part of March before it can undertake another uptrend.
Unfortunately, the recent weakness has altered a P&F pattern which held the promise of a substantial rally in the near future, and it will undoubtedly restrict the capacity of the next uptrend.
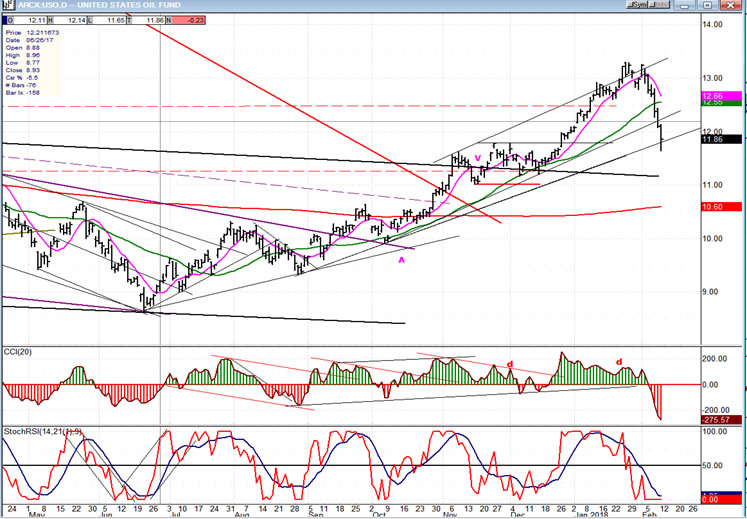
USO (United States Oil Fund)
USO is correcting after reaching the 13.00 price projection. Since this is only a phase projection, after some consolidation it should move to 15 and eventually to 18.00-19.00
Summary
SPX is engaged in the first intermediate correction since the one which bottomed in January 2016, at 1810. Although it found strong initial support at 2533 on Friday and rallied over a hundred points, it is too early to declare that the correction is over. At the very least, there should be base-building activity around the low point, but the risk of going lower next week still exists. By next Friday, we should have a much better idea of what the index wants to do over the near term.
Looking ahead: although a higher high is still the expectation before a much more serious correction takes place, more weakness should be anticipated in March. And it may not be until the next 40-wk cycle has made its low in May that the index will be in a position to attempt rallying to a new high.
Andre
For a FREE 4-week trial, send an email to anvi1962@cableone.net, or go to www.marketurningpoints.com and click on "subscribe". There, you will also find subscription options, payment plans, weekly newsletters, and general information. By clicking on "Free Newsletter" you can get a preview of the latest newsletter which is normally posted on Sunday afternoon (unless it happens to be a 3-day weekend, in which case it could be posted on Monday).
Disclaimer - The above comments about the financial markets are based purely on what I consider to be sound technical analysis principles uncompromised by fundamental considerations. They represent my own opinion and are not meant to be construed as trading or investment advice, but are offered as an analytical point of view which might be of interest to those who follow stock market cycles and technical analysis.
Andre Gratian Archive |
© 2005-2022 http://www.MarketOracle.co.uk - The Market Oracle is a FREE Daily Financial Markets Analysis & Forecasting online publication.