


Stock Markets Rise Impressive as Expected at 200 DMA: What Next ?
Stock-Markets / Stock Markets 2018 Apr 05, 2018 - 01:57 PM GMTBy: Builderadv

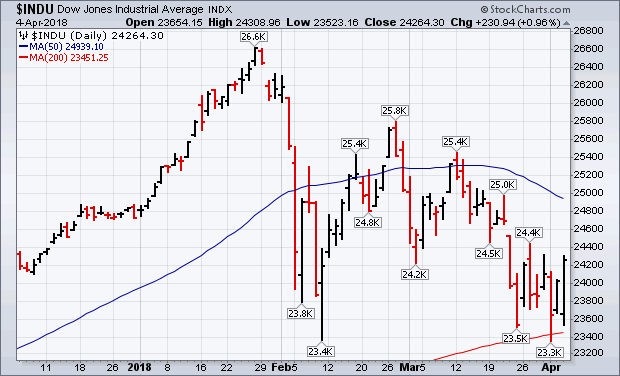
 We had expected the double bottom on stock market to result in a significant bounce. Read our report here: Markets to rise. The stock market staged an impressive upside turnaround today. After opening 500 points lower this morning, the Dow Industrials ended the day 230 points (0.96%) higher. That's a gain of more than 700 points from its opening price. Stock indexes gained roughly 3% from their sharply lower opening this morning. The fact that those upside turnaround took place at their 200-day averages was especially impressive. The Dow Industrials scoring an upside reversal day from just above its 200-day line. Initial overhead for the Dow to overcome is at 24,400. S&P 500 closing well above its 200-day average after opening below it this morning. That's a very encouraging sign. Initial overhead resistance for the SPX is at 2674. A close above that initial barrier would be an even more encouraging sign. The Nasdaq Composite Index also find support near its 200-day average. The Nasdaq was the day's strongest index with help from biotech and technology stocks. Small caps also had a strong day.
Small Caps showing strength
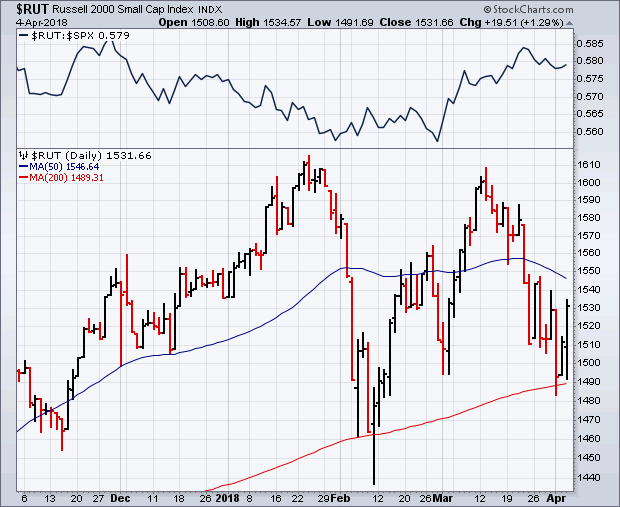
Small caps helped lead the day's upside reversal. Russell 2000 Small Cap Index gaining 1.29% (versus 1.1% for the S&P 500 Large Cap Index). And it also bounced impressively off its 200-day average. The solid line shows a relative strength ratio of the Russell 2000 versus the S&P 500 rising since the end of February. That shows that small caps have fared better than large caps during March and the first week of April. That may be partially due to the fact that domestically-oriented small cap stocks are less exposed to tariff threats than large multinational stocks. It's usually a good sign for both when small caps are acting better.
Apple: Bellweather showed some strength too
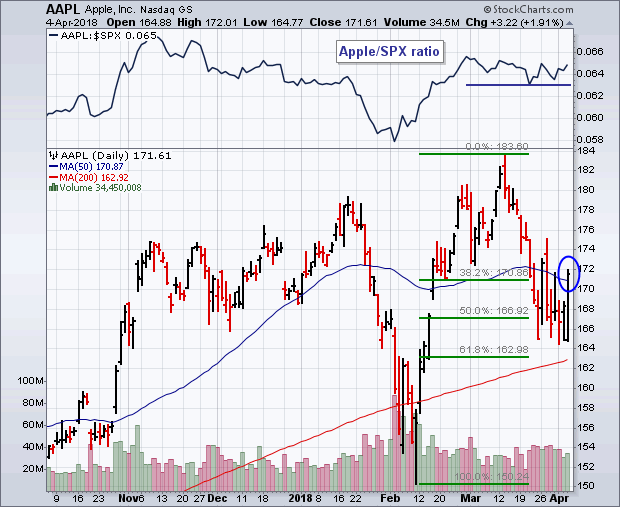
Apple (AAPL) climbing 1.9%. It was one of the day's most actively traded stocks. Apple remains above its 200-day average. And closed back over its 50-day line today (blue circle). The green lines also show the stock in a support zone between its 50% and 62% Fibonacci retracement lines. The fact that Apple is the market's biggest technology stock gives it even more importance. Its relative strength line (top box) shows the stock holding up much better than the S&P 500 over the last two months. That may be a good sign for both.
VIX still elevated
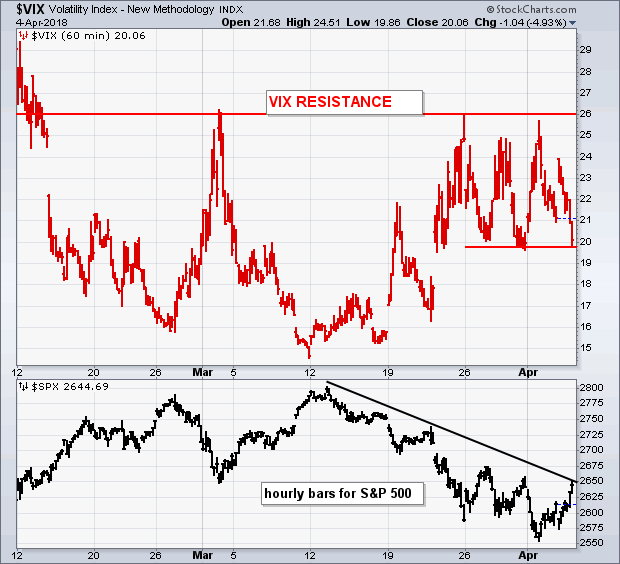
The CBOE Volatility (VIX) Index fell 5% today and in danger of falling back below 20. That's a positive sign for stocks. However it is very far from the comfort level of 15 which market the market rise from 2400 to 2800.
We are still not in clear waters but initial work on making base at the 200 DMA at 2588 on S&P has been completed. What happens next will determine the direction of equity markets for the rest of the year. If we break below 2580 again, we see major sell off to commence with next targets well under 2400.
A few key setups on forex currencies follow below.
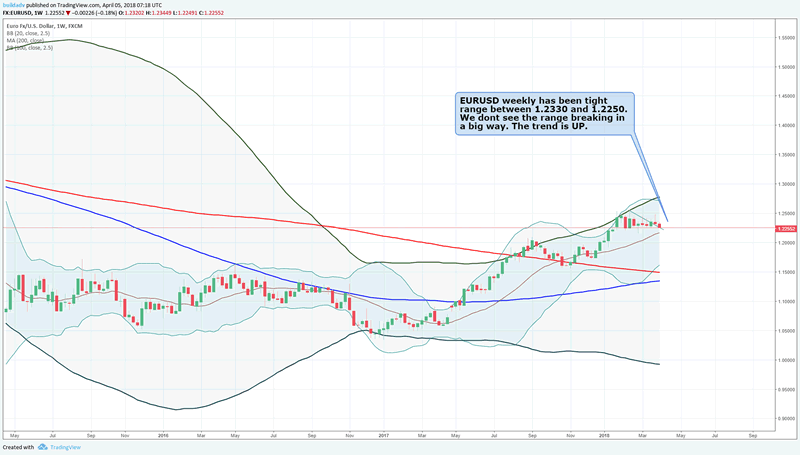
EURUSD weekly has been tight range between 1.2330 and 1.2250. We dont see the range breaking in a big way. The trend is UP.
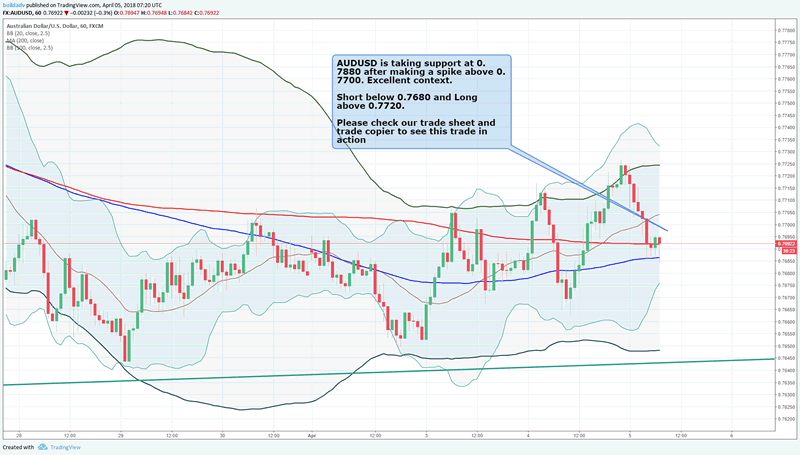
AUDUSD is taking support at 0.7880 after making a spike above 0.7700. Excellent context.
Short below 0.7680 and Long above 0.7720.
Please check our trade sheet and trade copier to see this trade in action
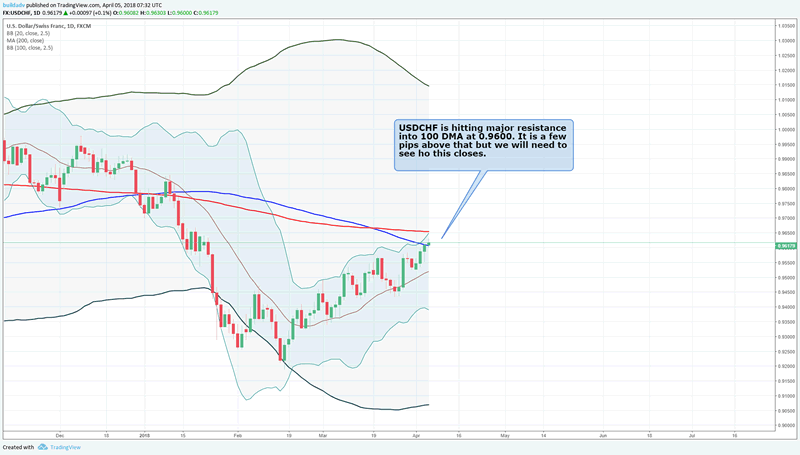
USDCHF is hitting major resistance into 100 DMA at 0.9600. It is a few pips above that but we will need to see ho this closes.
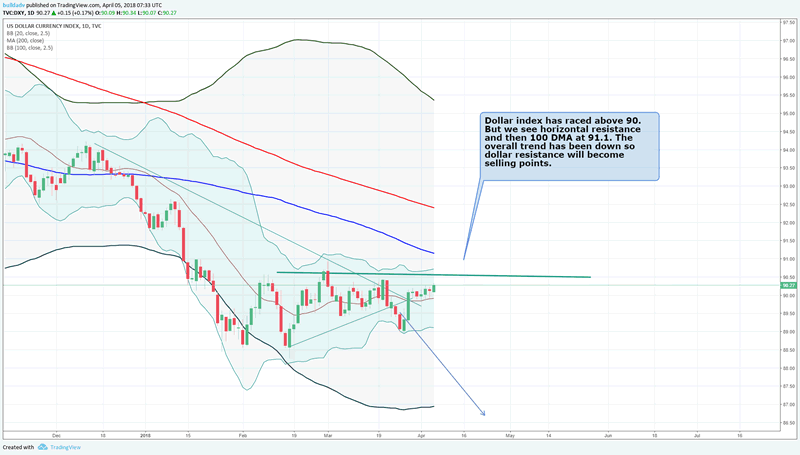
Dollar index has raced above 90. But we see horizontal resistance and then 100 DMA at 91.1. The overall trend has been down so dollar resistance will become selling points.
Trade Sheet
Our manual trade sheet is currently trading EURUSD,GBPUSD, AUDUSD, USDCAD , USDJPY. The trade sheet is for clients who do not have a MT4 account and would like to trade on their own. You can subscribe here: Membership
Trade Copier performance
Our trade copier has been doing brilliantly. March returned 11% and April is doing very well. It has a record of trades from 2010 to 2018 and every month has returned positive. No hedge fund or equity or bond trading system has a record like this one. The forex trading system featured here is one of the very best. See the returns.
To open a MT4 account with IC Markets, please do so here: Open a new MT4 account
You can use any MT4 broker who offers 1:500 leverage. Once the MT4 account is ready, please send us details and we will get you connected to our master account and you will receive trades.
Summary: S&P has risen at the 200 DMA. Dollar index has rallied above 90 levels in expectation of a good NFP. The next major resistance at 2700 for S&P while dollar index will have a realty check at 90.4 levels.
By Buildadv
About Buildadv:
Buildadv is a investment management firm. We specialize in premium trading research, chart setups, trading insights and a forex trade copier which generates returns for MT4 trading clients. We operate the BUILDFX Trading system which has a rich history of over 8 years of trading history generating an average return of over 15% a month.
Email: adminsupport@buildadv.com
Website: http://buildadv.com/contact/
Copyright 2018 © Buildadv - All Rights Reserved
Disclaimer: The above is a matter of opinion provided for general information purposes only and is not intended as investment advice. Information and analysis above are derived from sources and utilising methods believed to be reliable, but we cannot accept responsibility for any losses you may incur as a result of this analysis. Individuals should consult with their personal financial advisors.
© 2005-2022 http://www.MarketOracle.co.uk - The Market Oracle is a FREE Daily Financial Markets Analysis & Forecasting online publication.