


Hold Dividend Payers To Weather Stock Market Volatility
Stock-Markets / Dividends Apr 27, 2018 - 03:52 PM GMTBy: WMA

 So far in 2018, equities have swung wildly, leaving market participants with whiplash. Consider that the S&P 500 rose +7.5% in January, fell -11.5% in early February, jumped back +10.5% in March, fell back -8.2% at the end of March, rallied +5.4% in early April only to give back -3.7% since last week. Phew! Investors who have relied on the “trend is your friend” investment strategy have gotten absolutely crushed so far this year. Those who have made money in 2018 are the algorithmic and high-frequency traders, as well as the courageous (and lucky) day traders willing to stand in front of apparent run-away moves.
For most of us, trying to “trade” a volatile market, guessing which way a squiggly line will turn, is most often a losing proposition. Instead of buying rallies on optimism and selling after the market drops on fear -- a game that won’t last long no matter what the size of your portfolio – a much better strategy for most investors in a volatile market is patience. Hold high quality companies which pay a regular dividend (preferably with a high dividend yield), don’t fret about market swings, and patiently collect your dividend payments.
Some commentators worry that competition from bonds, following the recent rise in interest rates, will hurt equities in general and yield-paying equities in particular. We disagree. Yes, the break of the U.S. 10-Year Treasury yield above 3% this week -- the highest level since early 2014 -- makes bonds marginally more attractive. Compared to the S&P 500 dividend yield, currently at 1.96%, bonds are indeed offering a higher yield today. However, an argument can be made – based both on technicals and macro fundamentals – that bond yields will keep rising beyond 3% on the 10-Year U.S. Treasury. Again, as yields are rising, bond prices fall and investors should prefer seeking yield in dividend paying equities.
The technical argument is simple, as shown in the chart below. A major, multi-year downtrend was broken and a “double bottom” was put in at 1.35% (July 2012 and July 2016). Fundamentally, a strengthening economy with signs of inflation, plus a Federal Reserve in tightening mode, will put upward pressure on rates. Excessive debt levels in the U.S. will also contribute to higher yields as investors demand a higher risk premium for holding U.S. paper.
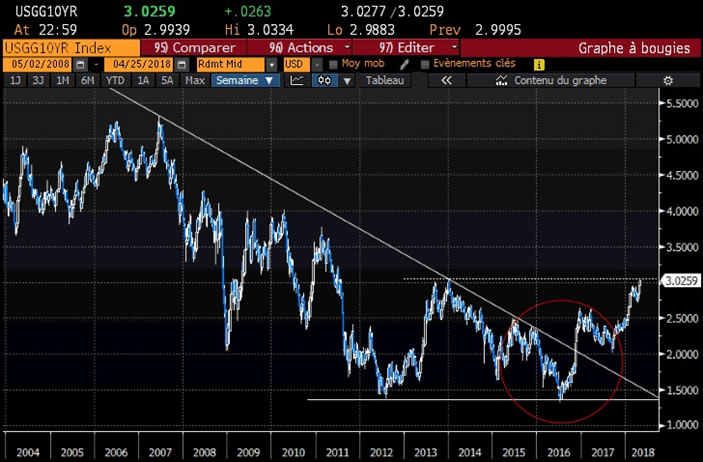
Readers must remember that, as yields rise, bondholders are losing with the fall in bond prices (inverse relationship between yield and bond price). Falling bond prices causes money to rotate out of bonds and into that other major asset class, notably equities. If indeed Bill Gross is right, and the bond market is making a major, multi-year secular trend change, what investor wants to see capital losses in his/her portfolio as bonds, purchased in a 3% rate environment, go deep underwater as rates elevate to 4.5%?
It is no surprise that high yield stocks have done well since the Financial Crisis, as central banks have held bond yields down with their zero interest rate policies. We believe that high yield stocks will continue to be for some time the best alternative for yield-seeking investors. As mentioned in last week’s Commentary, a good timing objective for continuing with high-yield stocks versus Treasurys is to wait for an inversion of the 10-year / 2-year Treasury yield curve, then counting out several months. Recall from last week’s Commentary that S&P 500 has peaked, on average, 12-months after an inversion of the 10/2 yield curve, with a range of +3 months (for 1981 recession) to +19 months (for both the 1990 and 2007 recessions).
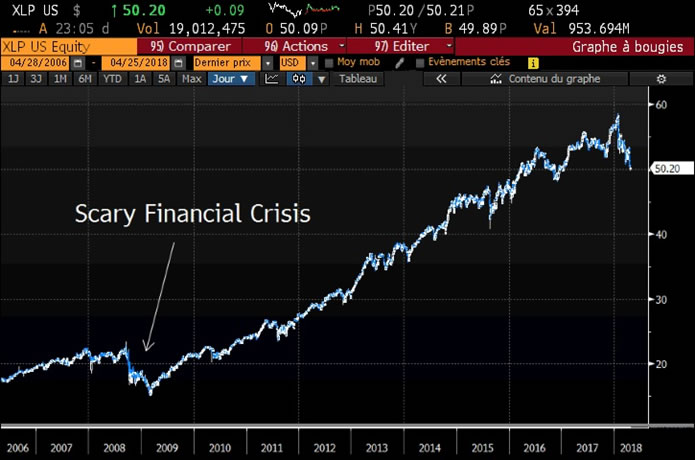
Buying traditional dividend-paying sectors via an ETF is likely to prove to be a sub-optimal strategy going forward. This is a time when a skilled stock-picker can add real value to portfolio. The table below compares the current indicated dividend yields associated with a selection of higher dividend-paying sectors.
Sector |
ETF ticker |
Annual Indicated Dividend Yield |
S&P Consumer Staples |
XLP |
2.38% |
S&P Utilities |
XLU |
3.05% |
Dow Jones U.S. Telecommunications |
IYZ |
3.03% |
Dow Jones U.S. Real Estate |
IYR |
3.34% |
Dow Jones Select Dividend |
DVY |
3.25% |
S&P 500 |
SPY |
1.66% |
WMA Ultra Yield Portfolio |
- |
8.03% |
Already, the current equity dividend yields on these popular sectors are hardly better than a 10-year Treasury today. Not to mention that the paltry equity dividend yields in no way compensate investors for the risk undertaken. Sometimes it’s best to take a big picture perspective of how far we’ve come. As a passive, yield-seeking investor, do you prefer to park your money today in the S&P Consumer Staples Index fund (XLP)…
…or in the S&P Utilities Index fund (XLU)?
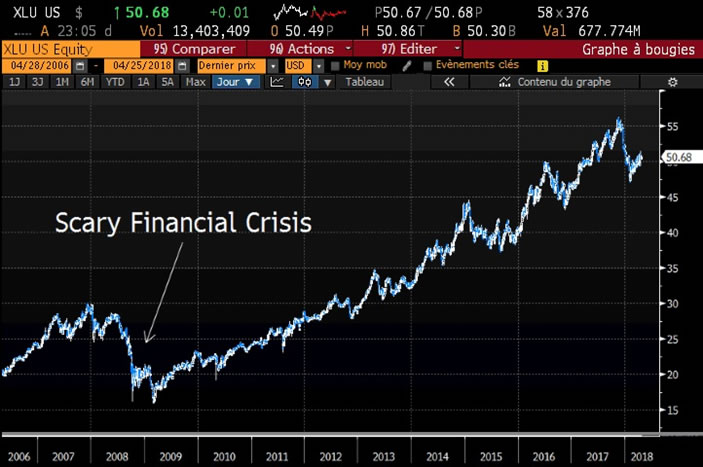
The phrase “none of the above” comes to mind.
Our Ultra Yield portfolio, which applies the same fundamental ranking methodology used in our Top Picks and Natural Resources portfolios, is a nice alternative to passive yield funds. Our portfolio, which currently provides an 8.1% annual dividend yield, sifts through listed companies paying a good dividend yield to eliminate those with high debt, poor cash flow or weak profitability. Month-to-date, the WMA Ultra Yield portfolio is up +2.8% versus -0.21% for the S&P High Dividend Index. The strategy has offered compelling returns thus far in 2018, as shown in the performance chart below.
Investors wishing more details on our Ultra Yield strategy are welcome to contact us.
Our readers will have understood at this point that the bond market will be determinant for equity allocations going forward. There is lots of talk about rising Treasury yields in the media and how awful this is for equity markets. Commentators have warned of cataclysmic consequences once the U.S. 10-Year yield breaks above 3%. Well, on Wednesday, the 10-Year yield finished the session at 3.01%....and the Dow rose +60 points. On Thursday the Dow added another +238 more points.
The impact of bond yields on the equity market is important to understand so we will summarize here the argument we’ve been making over the past weeks. Yes, higher rates increase the borrowing costs of businesses and make consumer loans more expensive. If long rates continue to rise steadily for months and months, economic growth will grind to a halt. However, the economy is not the stock market and the best gains in equities are made when bond yields are rising (see tables below). At what point rising Treasury yields become attractive enough to draw money from equities back into bonds is completely random (and is typically triggered by some negative event that inspires investor interest in safe-haven assets). However, as mentioned in last week’s Commentary, “Yields Will Signal The End of The Bull Market”, we are watching the relative increase of short Treasury yields versus long Treasury yields (an inversion of the yield curve) before flipping the hour glass and beginning the countdown to the end of the bull market.
As the subject of this Commentary is the dynamic of higher yield-paying companies within a changing interest rate environment, we looked at how dividend stocks have fared in both rising and falling rate periods.
While Treasury yields remain in an uptrend (since July 2016), we begin with an analysis of periods when money flows back into the bond market (ie: when yields are falling). Going back to pre-Financial Crisis, we identified six periods when the 10-year Treasury yield was in a multi-month down cycle. The first table looks at the correlation coefficients between several assets, including three popular dividend indexes:
- 10-Year Perpetual Treasury Note
- S&P 500 (SPX)
- Nasdaq-100 (NDQ)
- S&P 500 Low Volatility High Dividend Index (SPHD)
- Dow Jones Select Dividend Index (DVY)
- Nasdaq Dividend Achievers 50 (PEY)
10-Year Yield Peak |
10-Year Yield Trough |
Correlation Coefficient with 10-Year Yields |
|||||
|
|
10-Year T-Note |
SPX |
NDQ |
SPHD |
DVY |
PEY |
03/13/2017 |
09/08/2017 |
-1.00 |
0.291 |
0.140 |
0.008 |
0.225 |
0.193 |
06/12/2015 |
07/06/2016 |
-1.00 |
0.503 |
0.458 |
0.387 |
0.353 |
0.438 |
12/31/2013 |
01/30/2015 |
-1.00 |
0.516 |
0.426 |
0.314 |
0.355 |
0.411 |
02/04/2011 |
07/25/2012 |
-1.00 |
0.685 |
0.609 |
0.654 |
0.663 |
0.628 |
04/01/2010 |
10/07/2010 |
-1.00 |
0.696 |
0.650 |
0.672 |
0.679 |
0.651 |
06/12/2007 |
12/19/2008 |
-1.00 |
0.525 |
0.496 |
0.469 |
0.492 |
0.476 |
Mean |
-1.00 |
0.536 |
0.463 |
0.417 |
0.461 |
0.466 |
|
The positive coefficients simply show that stocks generally move inversely to Treasury bond prices. The correlation coefficients between the broad market S&P 500 and the dividend indexes do not differ significantly. This implies that there has been no diversification benefit in using passive dividend index trackers.
Looking at the returns on these same assets in falling interest rate environments, typically “risk-off” periods, we see that dividend indexes hold up quite well. When markets are worried, yield is a winning theme, whether it comes from bond coupons or stocks dividends.
10-Year Yield Peak |
10-Year Yield Trough |
Total Return |
|||||
|
|
10-Year T-Note |
SPX |
NDQ |
SPHD |
DVY |
PEY |
03/13/2017 |
09/08/2017 |
+3.47% |
+3.71% |
+9.62% |
+2.06% |
+2.42% |
+0.58% |
06/12/2015 |
07/06/2016 |
+6.01% |
+0.27% |
-0.20% |
+23.67% |
+15.41% |
+22.05% |
12/31/2013 |
01/30/2015 |
+6.36% |
+7.93% |
+15.49% |
+20.47% |
+14.29% |
+15.59% |
02/04/2011 |
07/25/2012 |
+14.05% |
+2.06% |
+9.02% |
+21.13% |
+17.13% |
+15.60% |
04/01/2010 |
10/07/2010 |
+9.57% |
-1.70% |
+2.66% |
+8.87% |
+4.18% |
+4.74% |
06/12/2007 |
12/19/2008 |
+24.25% |
-40.53% |
-35.62% |
-29.66% |
-40.01% |
-47.78% |
Mean |
+10.62% |
-4.71% |
+0.16% |
+7.76% |
+2.24% |
+1.80% |
|
The next table isolates five periods since the Financial Crisis during which interest rates were in a multi-month uptrend. Far from being afraid of rising interest rates, equity investors should get (or remain) greedy as the 10-Year Treasury rate pushes above 3%. Moreover, the dividend indexes tend to post positive returns as interest rates rise, lagging only slightly the broad market indexes.
10-Year Yield Trough |
10-Year Yield Peak |
Total Return |
|||||
|
|
10-Year T-Note |
SPX |
NDQ |
SPHD |
DVY |
PEY |
07/06/2016 |
04/26/2018 |
-10.92% |
+25.70% |
+46.56% |
+9.86% |
+19.08% |
+17.67% |
01/28/2015 |
06/12/2015 |
-3.35% |
+4.59% |
+7.57% |
-1.63% |
-2.26% |
+0.22% |
07/25/2012 |
12/31/2013 |
-9.01% |
+38.16% |
+40.91% |
+15.09% |
+34.05% |
+35.81% |
10/07/2010 |
02/04/2011 |
-6.73% |
+13.20% |
+16.23% |
+5.65% |
+7.33% |
+4.80% |
12/19/2008 |
04/01/2010 |
-10.65% |
+32.69% |
+60.99% |
+50.14% |
+21.60% |
+18.23% |
Mean |
-8.13% |
+22.87% |
+34.45% |
+15.82% |
+15.96% |
+15.35% |
|
Conclusion
Trading in volatile markets is best left to algorithmic and high-frequency traders. Investors are best advised to hold strong companies paying high dividends, as long as the economy stays out of recession. Rising interest rates imply “risk-on”, and investors should continue seeking yield in the equity market. Our WMA Ultra Yield strategy is out-performing the dividend indexes through a careful selection of the fundamentally- strongest dividend payers.
By Williams Market Analytics
http://www.williamsmarketanalytics.com
We provide insightful market analysis and account management founded upon our very successful systematic, disciplined approach to investing. Our investment analysis revolves around two inputs: company valuation and our quantitative, market-based indicators. Learn more about our approach and our strategist.
© 2018 Copyright Williams Market Analytics - All Rights Reserved
Disclaimer: The above is a matter of opinion provided for general information purposes only and is not intended as investment advice. Information and analysis above are derived from sources and utilising methods believed to be reliable, but we cannot accept responsibility for any losses you may incur as a result of this analysis. Individuals should consult with their personal financial advisors.
© 2005-2022 http://www.MarketOracle.co.uk - The Market Oracle is a FREE Daily Financial Markets Analysis & Forecasting online publication.