


Gold, US Stocks and Bonds
Stock-Markets / Financial Markets 2018 May 26, 2018 - 08:16 PM GMTBy: Gary_Tanashian

 I’ll try to keep things simple with this recap of the 3 of the 5 major food groups (leaving aside commodities and currencies) for investors. No confusing you today with too many inter-market ratios, overly technical language or cute metaphors like the 3 Amigos (although it is notable that Amigo #2 is stopping exactly as we’d forecast, as you’ll see in the Bonds segment below).
So let’s take a technical look at a larger picture of the 3 groups using weekly charts for gold and SPX and a monthly for 30yr bond yields, along with some thoughts. We’ll reserve the shorter-term technical management for subscriber updates and weekly NFTRH reports.
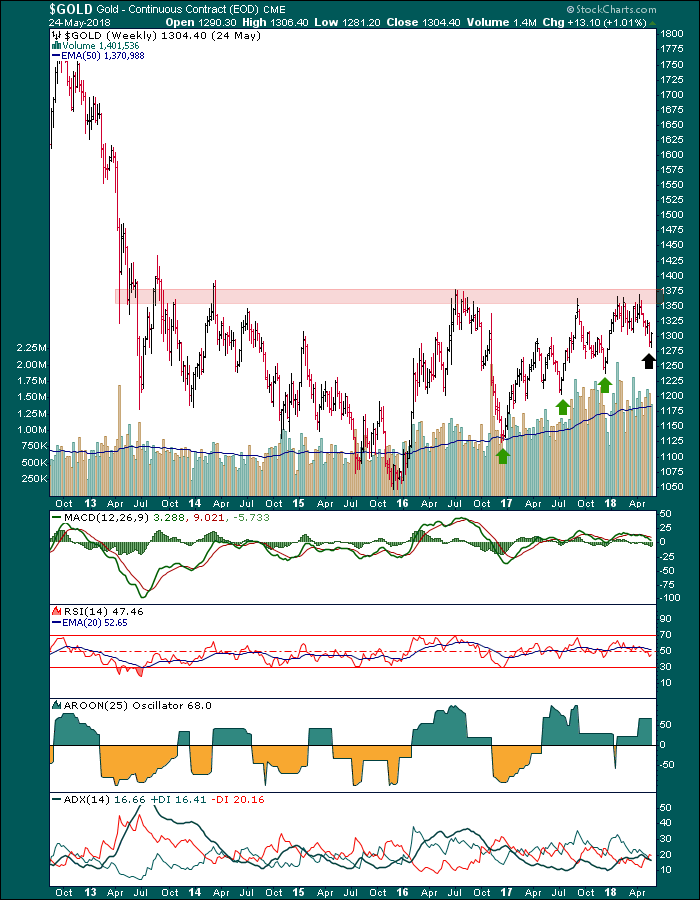
Gold
For the sake of your financial well being, continue to tune out inflation, trade wars, shooting wars, Ebola, China demand and Indian wedding season as reasons to be bullish the relic, it’s wilder little brother, silver and the miners. Continue to tune in to gold’s standing vs. stocks and other risk ‘on’ assets along with investor confidence, the economy, interest rate dynamics (including the yield curve) and to an extent, the state of your local currency.
As to the chart, the latest decline is a pullback of close to 100 bucks an ounce, but it occurs within a series of higher lows. It also occurs as we have been tracking a sector bounce and fleshing out some mildly positive short-term sector internals. If gold makes a lower low, say goodnight for a while. But do you suppose that if it bottoms here the next rally could be the one that finally breaks long-term resistance? The thing looks spring loaded and rising volume shows conviction building.
Silver and the miners continue to consolidate the big up turns of 1st half 2016 and the sector will be ready for prime time when the real fundamentals come into play. Again, tune out the China/India “Love Trade” crap. Tune out fixations on war, politics and even inflation. Tune in to gold’s relationship with the risk ‘on’ world, tune in to forward economic indicators and tune in to bond yield dynamics.
The macro fundamental picture is not optimal yet, but the technicals could lead the fundamentals as they did in Q1 2016. As of today the technicals have done no such thing, although a few ‘leader’ stocks are and have been bullish for quite some time. We track some of these as well as other miners each week.
Q4 2008 was quite the opposite as I had my hands sliced off catching falling knives as gold stocks crashed while their fundamentals had turned wildly bullish. Needless to say, it worked out and it is no coincidence that the most dynamic rally of the entire 2001-2011 bull market unfolded shortly thereafter. You make the real money in the sector after buying the deflationary liquidations, not running with the momentum of the inflation trades. So we can remain open to a final wipe out scenario as well if the current situation proves to be just another bounce. That would actually be preferable because the call to action would be clear amid a backdrop of liquidity contraction.
US Stocks
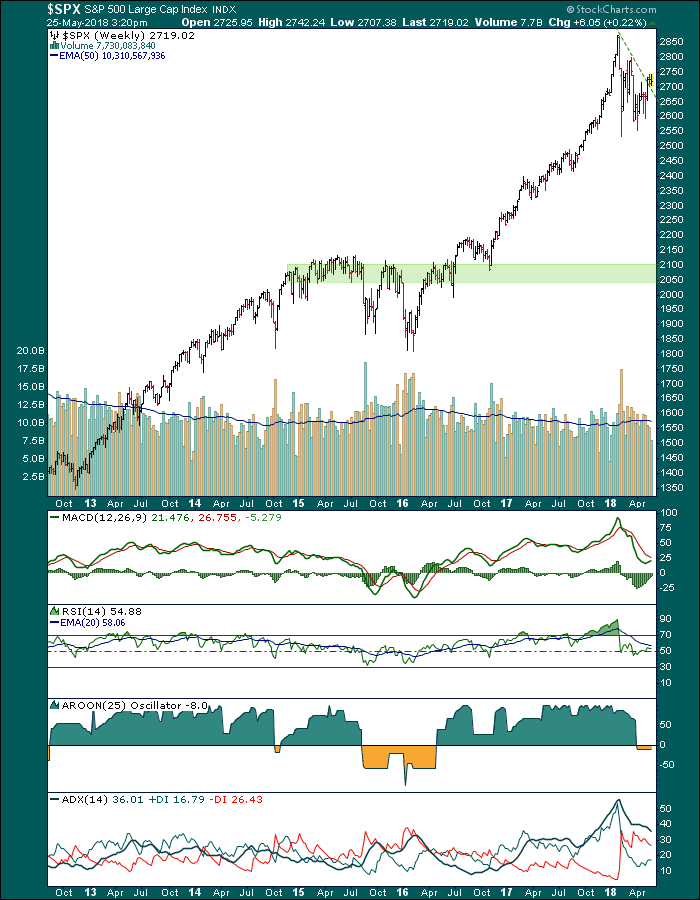
What else is there to say? The stock market is in a long-term bullish trend that anyone can see. What’s more, it has recently shifted to a short-term bullish trend in support of the ‘M’ top-test scenario we have had in play for several weeks. But folks, a test is just that [test: noun, a procedure intended to establish the quality, performance or reliability of something]. NFTRH is bullish short-term in line with said test potential and I have only a few very selective short positions as of now.
While the stock market has a ton of long-term support to its major post-2008 uptrend, a simple test of major support would be on the order of a 25% to 30% correction and would get the mainstream media alarming everybody right the hell out of stocks at the precise period they should be buying. For now I am long (with a ton of income-paying cash equivalents), but if we are right about the general game plan, the coming top-test would be pivotal. I’ll look forward to managing it closely in updates and weekend reports.
This chart shows the situation clearly. When SPX poked above the dashed trend line it improved the odds of a top-test in the coming weeks or few months. However, with investor complacency back in ‘sleeping comfy’ mode that test, if the market goes on to try it, could well fail. We have other cycle leadership indicators we’ll use at the appropriate time to hone the view.
Now, let me ask you how far down the S&P 500 can fall while remaining in a major bull market. Technically it would need to make a higher low in the low 1800s, but there is a massive shelf of support from the 2014-2016 formation that would be really tough to break. The kicker is that that area is 25% to 30% below the January highs and the media would be in full frontal titillation mode trumpeting the bear. But it would just be a cyclical bear.
My plan, if this were to play out would be to sell most longs on the top-test, get short (and cash) for the cycle and then load up at support. It’s easy to say now, but the market moves at its pace and the entire process could take until well into 2019 to play out… if it plays out. So… you guessed it, we need to manage and update the interim views to either stay on track or get on the right track if things change.
Bonds
This is the one I enjoy the most because this is the area that is central to everything (the economy, inflation, deflation, etc.) in the way it affects so many other markets and in the way the media love to put the bond experts out front and put the herds that follow them off sides.
The monthly chart of the Continuum ™ (30yr Treasury yield) has halted, amid the media’s 3G blitz of bearish bond experts (bullish the yield), Gurus Gross and Gundlach (with a side order of Dalio and Tudor Jones), at least temporarily right at the limiter (red dashed EMA 100).
We have used this for many years as a gateway to the macro “real or Memorex?” question. While the 30yr yield has some bullish technical and fundamental aspects behind it, it ain’t real until it’s real. Now, will it get real? Quite possibly, but first sentiment has to clear and the herds need to be rearranged from over bearish bonds to the other side of the boat. Watch for those media jingles!
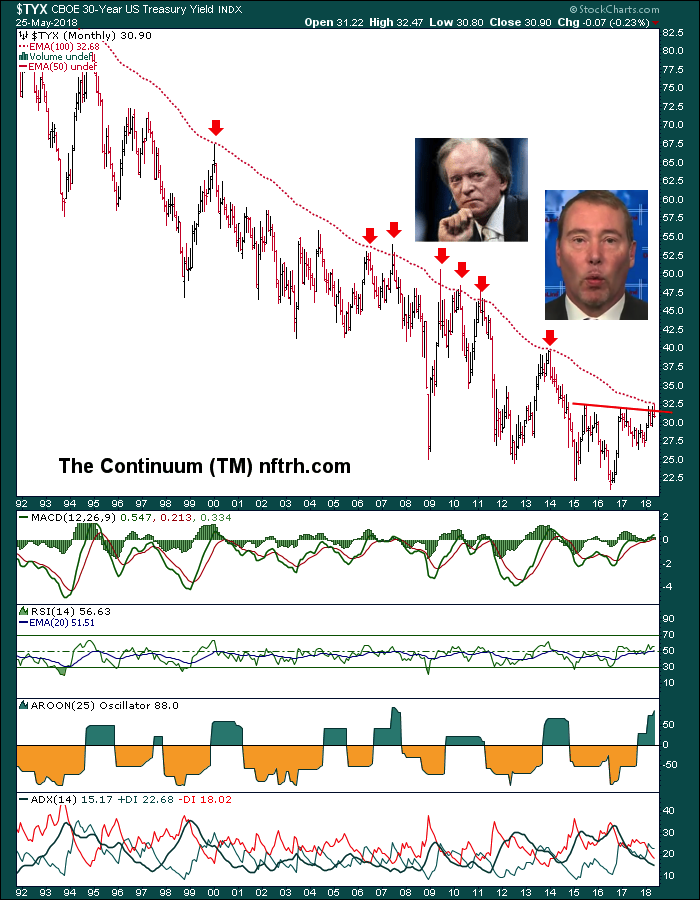
The rising yield hype, heavily rotated to the public at precisely the time they should have been backing away from the play is another lesson that we need to trust real research and real honest work; not lazy media bromides and the easy answers some mainstream analysis feeds you. As just one example it might have been worth asking ‘why has the Financial sector negatively diverged long-term yields in 2018?’ as we noted in last weekend’s report.
There is much more to the picture, not only in gold, stocks and bonds. But the whole macro, which is an ecosystem (heavily polluted by aggressive central banking) continually moving forward. It takes management, an unbiased view and when needed, ego-free revision. The above is just a general snapshot at this moment.
Subscribe to NFTRH Premium for your 40-55 page weekly report, interim updates and NFTRH+ chart and trade ideas or the free eLetter for an introduction to our work. Or simply keep up to date with plenty of public content at NFTRH.com and Biiwii.com. Also, you can follow via Twitter ;@BiiwiiNFTRH, StockTwits, RSS or sign up to receive posts directly by email (right sidebar).
By Gary Tanashian
© 2018 Copyright Gary Tanashian - All Rights Reserved
Disclaimer: The above is a matter of opinion provided for general information purposes only and is not intended as investment advice. Information and analysis above are derived from sources and utilising methods believed to be reliable, but we cannot accept responsibility for any losses you may incur as a result of this analysis. Individuals should consult with their personal financial advisors.
Gary Tanashian Archive |
© 2005-2022 http://www.MarketOracle.co.uk - The Market Oracle is a FREE Daily Financial Markets Analysis & Forecasting online publication.