


Gold And The Elusive Chase For Profits
Commodities / Gold and Silver 2018 Jul 17, 2018 - 02:57 PM GMTBy: Kelsey_Williams

 Between the years 1971 and 2011, the price of gold went from $42.00 per ounce to $1900.00 per ounce – a forty-five fold increase. This is depicted on the chart below…
Looking at the chart, it would appear that gold is in a long-term bull market and that continually higher prices over time can be expected. Proponents of this approach to gold cite fundamentals such as a weakening U.S. dollar, social unrest, wars (combat and trade), political instability, etc.
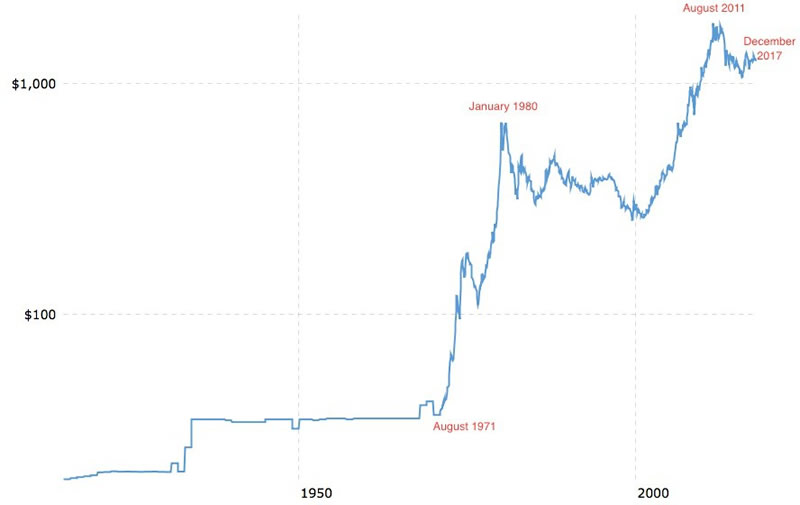
And the numbers seem to bear this out. For the forty-year period between August 1971 and August 2011, the price of gold was up forty-four hundred percent.
But are we really making any money? The chart below paints a clearer picture…
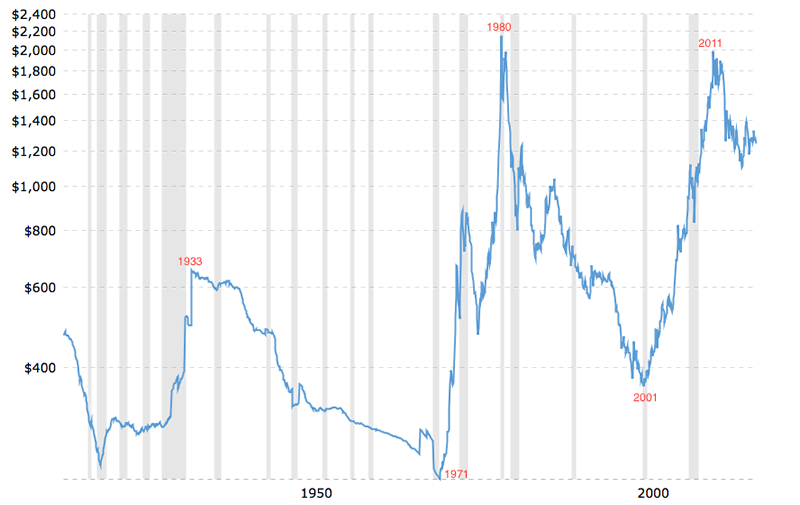
The inflation-adjusted chart immediately above seems to support a severely modified view of gold from that which we mentioned earlier. Rather than long-term, ever-higher, onward and upward, we see strictly defined periods of extreme volatility. Indeed, it appears almost cyclical.
And our previous total return of 4,400 percent for the forty-year period August 1971 to August 2011, is reduced to 900 percent. Even so, that is the equivalent of a 6% average annual return, net of inflation. Which is huge.
(In case you are interested, the average annual return for the S&P 500 – with dividends reinvested – for the same exact time period, is 5.13 percent. That relatively small differential on an annual basis is magnified considerably when you compare cumulative total returns: Gold at 900% vs. S&P 500 at 639%)
So, does the nine hundred percent total return/6% annual return represent a profit? Yes, most definitely. Net of the effects of inflation, the price of gold increased ten-fold; all of which represents added value. Here’s why…
In 1971, the cost for one loaf of bread was $.24. The average cost for one gallon of gasoline was $.36. With gold at $42.00 per ounce, you could purchase one hundred seventy-five loaves of bread or one hundred seventeen gallons of gasoline (or some combination of the two).
Forty years later, in 2011, the average cost for one loaf of bread was $2.42; and one gallon of gasoline was priced at $3.52. Hence, again, using only one ounce of gold (this time priced at $1900.00 per ounce) you could purchase seven hundred eighty-five loaves of bread or five hundred thirty-nine gallons of gasoline.
The additional six hundred ten (785-175) loaves of bread or four hundred twenty-two (539-117) gallons of gasoline represent an increase in real value/purchasing power for gold for the years between 1971 and 2011.
All of this sounds good. But there are some other issues. Looking again at the first chart, we can see that the price of gold increased from $850.00 per ounce at its 1980 high point to $1900.00 per ounce at its 2011 high point. This translates to a gain of $1050.00 ($1900.00 – $850.00) per ounce, or one hundred twenty-three percent.
Unfortunately, on an inflation-adjusted basis, you would have a negative, net return of ten percent. In real terms, the price of gold did not even match its 1980 high. And this result is after waiting for thirty-one years.
Owning gold from January 1980 until August 2011, a total of thirty-one years (during which its price rose from an all-time high of $850.00 per ounce to a subsequent, new all-time high of $1900.00 per ounce), resulted in a cumulative, net loss of ten percent in inflation-adjusted, real terms.
That doesn’t sound good, but it is even worse considering the decline in gold’s price since 2011. With gold currently priced at $1240.00 per ounce, the cumulative net loss balloons to forty-four percent (certainly not a supporting factor for the argument that gold is a long-term inflation hedge).
Another way of looking at it is that all of the real profits – nine hundred percent cumulative total return – from the forty-year period (1971-2011) came in the first nine years, 1971-80.
When President Nixon suspended convertibility of the U.S. dollar into gold in 1971, his action ushered in a decade-long period of U.S. dollar weakness and rejection. The effects of inflation created over the previous four decades, initially in an attempt to extricate us from the economic depression of the thirties, then to fund the country’s expenses relative to its involvement in WWII, etc. came roaring to life in the form of higher prices for all goods and services.
The 1970s were a catch-up period for the price of gold relative to the U.S. dollar’s loss in value over the previous four decades. That, and the anxiety and anticipation created by the realization that things were far worse than we had previously known, led to outsized gains.
Gold’s failure to make a new, inflation-adjusted high in 2011 is perfectly reasonable. This is because gold’s upward price movement reflected the extent of ongoing U.S. dollar devaluation that had occurred since the eighties. Whereas, the price movement upward in the seventies reflected U.S dollar devaluation that had occurred over the prior forty years – a period more than twice as long.
Gold’s price is not an indication of its value. The value of gold is constant and does not change. Its price is a reflection of the value of the U.S. dollar. Nothing more. Nothing less. Nothing else.
And what is happening to the US dollar? It is in a state of constant deterioration, punctuated with periods of relative stability.
And the peaks and low points for those periods are seen clearly on both charts (1933, 1971, 1980, 2001, 2011) and correspond with highs and lows for the price of gold, both in nominal and real terms.
Gold is not an investment. When gold is characterized as an investment, the incorrect assumption leads to unexpected results regardless of the logic. If the basic premise is incorrect, even the best, most technically perfect logic will not lead to results that are consistent.
In light of all this, what can we expect from gold looking ahead? Or, better phrased, what can we expect from the U.S. dollar; and how does that translate to expectations for the price of gold?
One possibility is that the U.S. dollar could continue to stabilize and strengthen along with an improving economy. The price of gold would stabilize and move lower reflecting the dollar’s relative strength. This is similar to what happened between 1980 and 2001, and what we are currently experiencing since 2011. And it could go on this way for years. During periods like this, you should not expect gold’s price to increase.
Another scenario is that the dollar could renew its long-term decline in rapidly accelerating fashion, eventually ending in complete rejection and repudiation. In which case, owning gold is imperative for wealth preservation and financial survival. But any profits would be elusive. At a time like that, the U.S. dollar price of gold becomes meaningless. What does matter, and what is critical, is how much gold you own.
Lastly, attempts by the Federal Reserve to unwind its horrendously bloated balance sheet and encourage a return to a relatively normal level of interest rates could backfire. We could see a another credit collapse. This one would be much worse than anything we have experienced to date, and the unwinding of prices for all assets (stocks, bonds, real estate, commodities) denominated in dollars would trigger a full-scale depression and lead to a suppression of most economic activity. Don’t look for gold to save you. The U.S. dollar would increase in value; thus, gold’s price in dollars would decline significantly. The US dollar would actually buy more, not less. But the supply of US dollars would be significantly less. This is true deflation, and it is the exact opposite of inflation.
There are, of course, variations and combinations of the above scenarios that may play out. Any actions or responses by government and the Federal Reserve will affect the magnitude and duration of various crises.
Whatever the course of events, or how they unfold, there is no fundamental reason for gold to make new inflation-adjusted highs.
The case for gold is not about price. It is about value. And its value will become readily apparent when governments and individuals are scrambling amid the ruins of our financial system looking for something, anything, to replace worthless paper currencies. which are nothing more than substitutes for real money.
By Kelsey Williams
http://www.kelseywilliamsgold.com
Kelsey Williams is a retired financial professional living in Southern Utah. His website, Kelsey’s Gold Facts, contains self-authored articles written for the purpose of educating others about Gold within an historical context.
© 2018 Copyright Kelsey Williams - All Rights Reserved Disclaimer: The above is a matter of opinion provided for general information purposes only and is not intended as investment advice. Information and analysis above are derived from sources and utilising methods believed to be reliable, but we cannot accept responsibility for any losses you may incur as a result of this analysis. Individuals should consult with their personal financial advisors.
© 2005-2022 http://www.MarketOracle.co.uk - The Market Oracle is a FREE Daily Financial Markets Analysis & Forecasting online publication.