


US Q2 GDP vs. TechnologyStocks Concerns vs. Foreign Markets
Stock-Markets / Stock Markets 2018 Jul 30, 2018 - 10:19 AM GMTBy: Chris_Vermeulen

This past week has been very interesting in the US markets for a couple of reasons. It is time we took a hard look at what to expect going forward and ho in the US. 4.1% GDP for Q2 is massive compared to the previous administrations GDP levels. Granted, these levels may not be sustainable in the long term above 4%, but we can only assume levels above 3% are going to last for a while unless something dramatic changes the economic footing within America.w this news will likely drive future market moves.
First, the Q2 GDP number came in as a huge boost to the US economy and for the future expectations of economic growth
Secondly, Facebook and Twitter both missed on earnings and growth numbers. These two stocks got crushed in the process. One thing to consider is that Facebook is within a transitional phase with the Federal government and the SEC investigating the company for illegal activity and for illegally allowing external firms to data-mine the user base. These issues have likely resulted in a decrease in the total user base for Facebook and in a general dissatisfaction for existing users. A certain group of people will simply stop using Facebook because they don’t agree with or condone these activities and don’t want to be a part of these issues.
Twitter, on the other hand, has had a rough go of it for years. With a failure to properly monetize the company and users on top of recent concerns that “shadow banning” and “political bias” has infiltrated the SOP (standard operating procedures) of the company’s leadership, it appears Twitter is not being targeted as a “biased social platform” that could result in further headwinds for success.
The end result is that these two stocks don’t make up the entire stock market – they are just relatively large components of a much bigger market of stocks.
As we have been stating for months, the capital migration from foreign sources into the US markets have been a major driving force over the past 24 months. This capital is searching for safe and equitable growth opportunities. We are certain that a large portion of this capital found a home in Facebook and Twitter – as well as other stocks. These investors may be shocked by the recent collapse of FB and TWTR, but we are relatively certain that these investors will likely continue to hold their positions for one reason – the expectations that the US economy is strong and the recovery of these two stocks will likely take place over the next 6 to 12+ months without much issue.
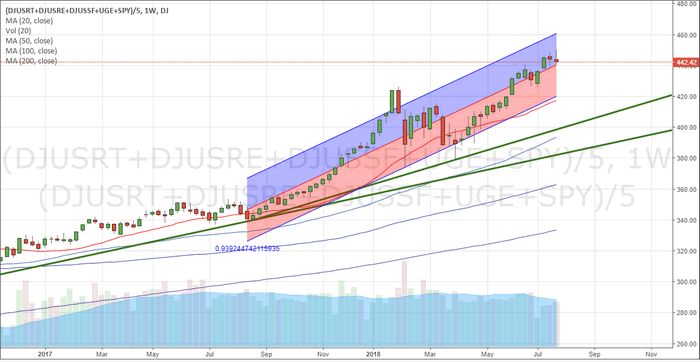
When we take a look at the longer term charts, we can see a fairly clear picture of the recent price rotation (January 2018) and the most recent upswing in prices. This, our Custom US Index Weekly chart, shows exactly what we see in terms of trend and expectations. The Std. Deviation channel is key to understanding future price rotation, if it happens. As long as the lower Std. Dev channel is nor breached, price should find support and rotate higher as expectations continue to drive prices higher and as foreign capital continues to rush into the US markets.
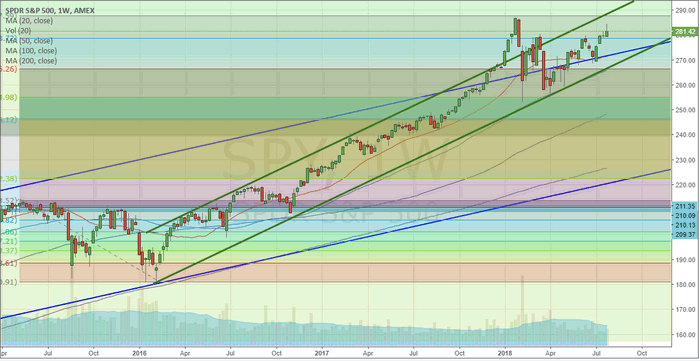
This Weekly SPY chart shows a similar price channel setting up from 2016. Actually, there are two price channels at play. The Blue levels originate from the lows in 2009 and track price trends all the way through 2015~2016. The upper Blue channel is currently creating support for prices moving forward. The Green channels are more recent and originate from 2016. Ideally, as long as price stays above the lower Green price channel, the trend is Bullish and we should expect mild price rotation.
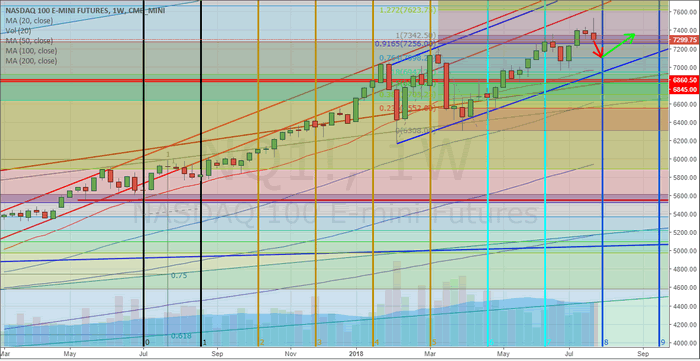
Lastly, this NQ Weekly chart shows a bit more detail including our Time/Price cycles that indicate we should see some moderate price rotation over the next few weeks. We don’t expect this rotation to be deep or excessively volatile, but we do expect some type of narrow price rotation to occur. You can see from the arrows we’ve drawn on the chart that we expect prices to hover below or near 7400 for the next 3~5+ weeks – as we’ve been warning about for the past 30+ days. The NQ will likely become range bound below 7400 for the next few months – possibly throughout the end of 2018.
The price channels shown on this chart, in Blue, are still critical to the longer term trends. Once these channels are broken to the downside, then we would be more concerned of further and deeper downside price pressures. As of right now, nothing is showing us any real concern and the Q2 GDP numbers will act as a booster rocket for the US economy unless something derails over the next 3~6 months.
The short sellers that have been setting up for a massive and deep price correction may see a bit of profits in some stocks that rotate lower, like FB and TWTR, but our analysis is showing these traders are taking a risky position getting setup for a deeper and broader market rotation downward. At this point, with incredible GDP growth, strong earnings, a strong US economy and foreign capital rushing into the US market/stocks – we just don’t see the downside potential that others seem to see.
For months we have been posting our analysis stating the markets would push higher from the February lows. We have stood by our analysis and weathered some criticism over the past few months. Still, the markets continue to push higher and the news just seems to support our predictive modeling systems analysis. Currently, a unique sector rotation is taking place that traders need to be aware of. This will likely not become a broad market rally where everything goes up for weeks of months. This will likely become a select sector rally in the markets based on expectations and opportunities. Last week to locked in 12% profit on the financial sector using FAS, and we feel its still headed higher!
If you want to learn more about our analysis and our opinions regarding what will move and when, then visit www.TheTechnicalTraders.com to learn how we can help you find greater profits in these markets. Our predictive modeling systems have been calling these markets almost perfectly for the past 8+ months. Isn’t it time you invested in your future success and take advantage of the features and benefits we can offer to you?
Become A Technical Trader Today and Profit! – CLICK HERE
Chris Vermeulen
www.TheTechnicalTraders.com
Chris Vermeulen has been involved in the markets since 1997 and is the founder of Technical Traders Ltd. He is an internationally recognized technical analyst, trader, and is the author of the book: 7 Steps to Win With Logic
Through years of research, trading and helping individual traders around the world. He learned that many traders have great trading ideas, but they lack one thing, they struggle to execute trades in a systematic way for consistent results. Chris helps educate traders with a three-hour video course that can change your trading results for the better.
His mission is to help his clients boost their trading performance while reducing market exposure and portfolio volatility.
He is a regular speaker on HoweStreet.com, and the FinancialSurvivorNetwork radio shows. Chris was also featured on the cover of AmalgaTrader Magazine, and contributes articles to several leading financial hubs like MarketOracle.co.uk
Disclaimer: Nothing in this report should be construed as a solicitation to buy or sell any securities mentioned. Technical Traders Ltd., its owners and the author of this report are not registered broker-dealers or financial advisors. Before investing in any securities, you should consult with your financial advisor and a registered broker-dealer. Never make an investment based solely on what you read in an online or printed report, including this report, especially if the investment involves a small, thinly-traded company that isn’t well known. Technical Traders Ltd. and the author of this report has been paid by Cardiff Energy Corp. In addition, the author owns shares of Cardiff Energy Corp. and would also benefit from volume and price appreciation of its stock. The information provided here within should not be construed as a financial analysis but rather as an advertisement. The author’s views and opinions regarding the companies featured in reports are his own views and are based on information that he has researched independently and has received, which the author assumes to be reliable. Technical Traders Ltd. and the author of this report do not guarantee the accuracy, completeness, or usefulness of any content of this report, nor its fitness for any particular purpose. Lastly, the author does not guarantee that any of the companies mentioned in the reports will perform as expected, and any comparisons made to other companies may not be valid or come into effect.
Chris Vermeulen Archive |
© 2005-2022 http://www.MarketOracle.co.uk - The Market Oracle is a FREE Daily Financial Markets Analysis & Forecasting online publication.