The Stealth Reason Why the Stock Market Keeps On Rising
Stock-Markets / Stock Markets 2018 Sep 20, 2018 - 10:48 AM GMTBy: Gordon_T_Long
 KEY MESSAGE:
- The US stock market continues to rise because it is increasingly dominated by shrinking "availability & supply",
- All three stock "Pools" are shrinking in a stealth & unappreciated fashion,
- There is an increasing potential for a "Minsky Melt-Up" based on an even stronger US dollar (i.e. An Emerging Market Flight to Safety),
- Expect a coming M&A corporate focus using inflated stock as the takeover currency to answer slowing corporate growth .... further reducing listing and outstanding share pools.
- Expect market rotation from Growth to Value in the near term versus the final Topping of the equity markets.
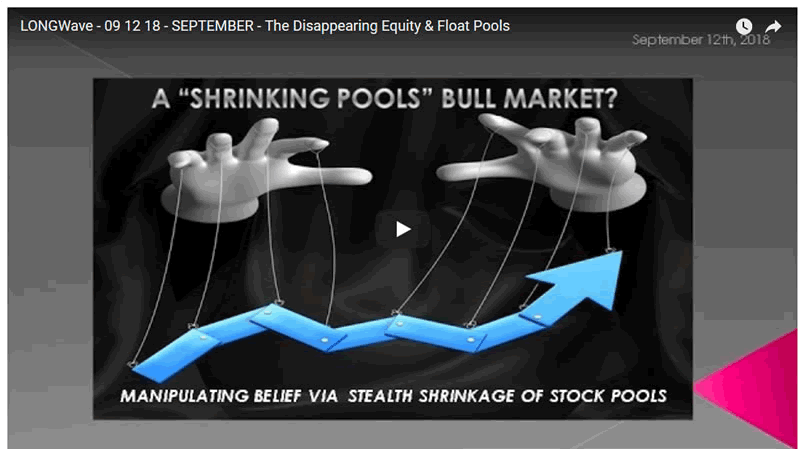
Too many investors have become fixated on stock Demand Growth due to global central bank liquidity injections, record high investor sentiment and (thanks to the sugar high of Trump Tax reductions) improving US Economic data. No doubt all have been important! However, it has become increasingly critical to properly assess Shrinking Stock Supply to know both why the stock market may still continues rising in the face of Quantitative Tightening and what consequentially might trigger an equity market reversal. The Three Major US Stock Market "Pools" are all shrinking in a dramatic and stealth fashion.
- SHRINKING POOL OF # PUBLIC LISTED COMPANIES
- SHRINKING POOL OF # PUBLIC SHARES OUTSTANDING
- SHRINKING POOL SIZE OF PUBLIC FLOAT
Too Many Investors Trying to Get Into the Shrinking Stock Pool
SHRINKING POOL OF # PUBLIC LISTED COMPANIES
Stock markets have in recent years been shrinking by listings (but not by market cap). According to data from the Center for Research in Security Prices at the University of Chicago Booth School of Business in 1996, there were actually 8,023 public listed US corporations. This has been reduced to 3,627 by 2016 or a 55 reduction%.
Going back 40 years to 1976 (prior to the dotcom explosion in IPOs which occurred in the 90's) the US had 4943 public listings. This is still a 27% reduction in publicly listed firms over a 40 year period. Meanwhile the population of the United States has grown nearly 50 percent since 1976, the drop is even starker on a per-capita basis where there were 23 publicly listed companies for every million people in 1975, but only 11 in 2016,
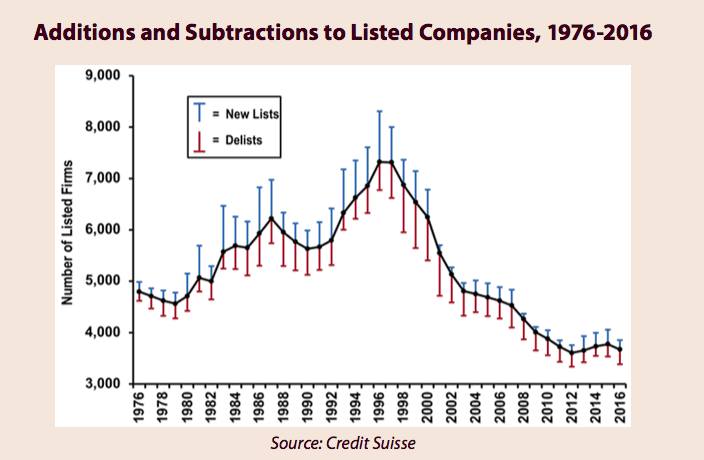
This is not unique to just the US. In Germany for example the number of listed firms fell by 41 percent during the past decade alone , to only 450.
The reasons are multi fold and include:
- Mergers & Acquisitions,
- Dramatic reduction in US IPOs,
- Increasing Buyouts and Control Blocks by Private Equity.
- A few bankruptcies along the way (and more to come when Zombie Corporations are forced to face realities when higher interest rates come home to roost)
Also many companies are going “all the way into oblivion" by buying up all of their shares over time and "Going Private" or "Dark".
Many executives & boards have simply become tired of the quarterly “rat race” of reporting numbers which may “beat” or “miss” the expected earnings target by a penny or two and so the stock gets hammered. They don’t want to manage toward quarterly expectations, which they consider to be an unhealthy short-term focus for a company’s long-term health or are forced to divulge more information on Intellectual Property and Innovation advantage secrets than they want (giving both investors and competitors insights) and so they keep the company private or take the company private.
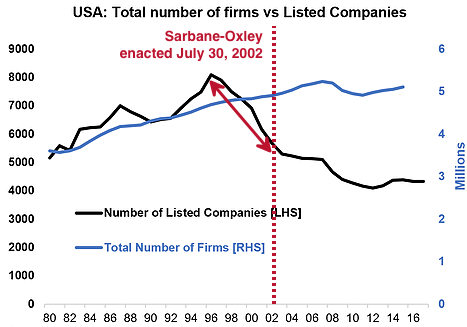
Additionally, the punitive legal liabilities associated with Sarbane-Oxley for publicly traded corporate executives is also a major dis-incentive that can't be understated.
SHRINKING POOL OF PUBLIC # SHARES OUTSTANDING
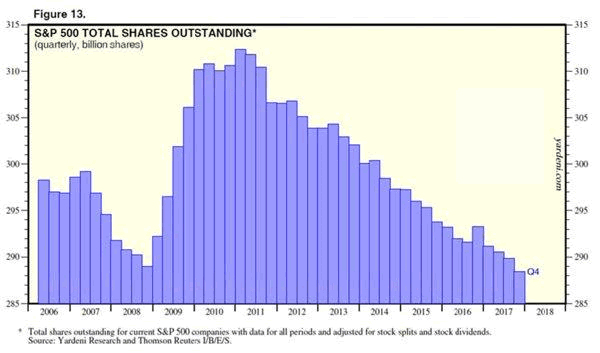
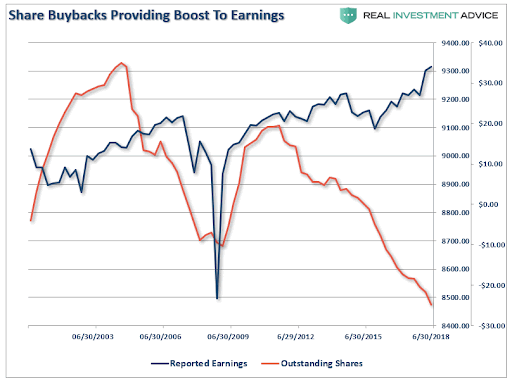
But the even bigger Kahuna is Buybacks or the actual reduction of shares outstanding by major public traded entities.
As big as $3.5 trillion in buybacks has meant over the last 5 1/2 years, it has only got larger in 2018 due significantly to Trump's Tax changes and US corporate repatriation of their off-short cash. It is anticipated by Goldman Sachs that stock buybacks in 2018 will approach $1 Trillion.
Historic low interest rates presently continue to spur corporate borrowing via historic levels of debt issuance.
SHRINKING POOL SIZE OF PUBLIC FLOAT
The stock pool reduction is the one pool least understood or fully appreciated. In 2005 the US markets were changed to a "Float Adjusted Market Capitalization" system. This change in 2016 had the effect of reducing the public float by approximately $1 Trillion!
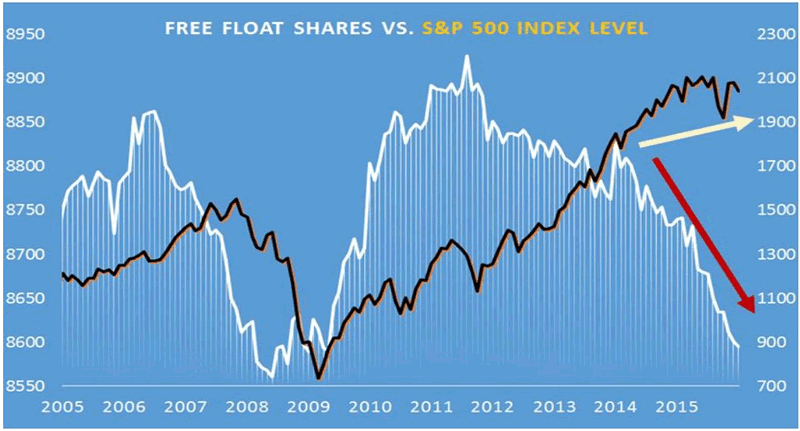
The market Float is the number of shares actually available for trading. Float is calculated by subtracting the closely held shares -- owned by insiders, employees, the company's Employee Stock Ownership Plan or other major long-term shareholders -- from the total shares outstanding. The Float can be difficult to determine and therefore requires and depends on definitions. The public is unaware of how this is determined and generally have to pay service providers for this information. We encourage you to review our recent 16 minute video outlining the details and possible games being played here.
The size of those who are considered within the "control block" is surprisingly large. Shareholders concerned with control of a company generally include the following:
- Officers and Directors and related individuals whose holdings are publicly disclosed
- Private Equity, Venture Capital & Special Equity Firms
- Shares held for control by another Publicly Traded Company
- Strategic Partners
- Holders of Restricted Shares
- ESOPs
- Employee and Family Trusts
- Foundations associated with the Company
- Holders of Unlisted Share Classes of Stock
- Government Entities at all levels except Government Retirement/Pension Funds
- Any individual person listed as a 5% or greater stakeholder in a company as reported in regulatory filings (a 5% threshold is used as detailed information on holders and their relationship to the company is generally not available).
Additionally, the following holders’ shares are generally considered part of the control block:
- Depository Banks
- Pension Funds
- Mutual Funds & ETF providers
- 401K Plans of the Company
- Government Retirement/Pension funds
- Investment Funds of Insurance Companies
- Asset Managers and Investment Funds
- Independent Foundations
- Savings and Investment Plans
In other words the actual float available to trade is shrinking dramatically.
CONCLUSION
There is much more than just shrinking "Pools"keeping the market supply shrinking which include the failures of an obsolete accounting system and the changing role of public exchanges in the overall "capital raise" process. We suspect due as a result of our research on Zombie Corporations (here, here & here) that M&A will be the answer soon sought to slowing corporate growth (using inflated stock as the currency) which will further aggravate the shrinking stock pools phenomenon.
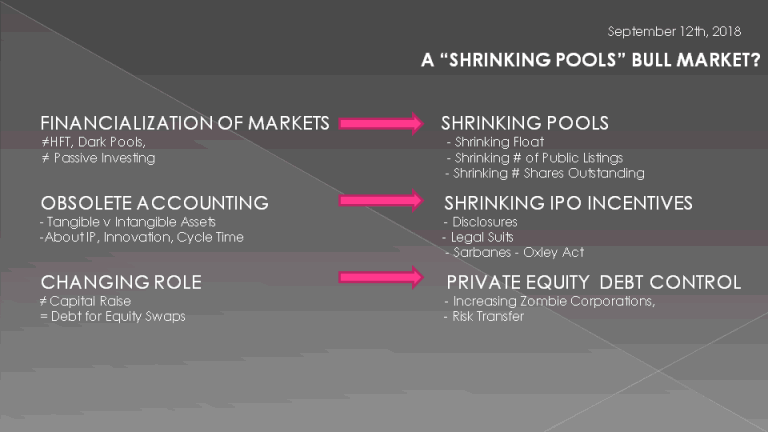
All of the above and more is explored in this 21 minute video.
Signup for notification of the next MATASII Macro Insights
Gordon T. Long
Publisher - LONGWave
Signup for notification of the next MACRO INSIGHTS
Request your FREE TWO MONTH TRIAL subscription of the Market Analytics and Technical Analysis (MATA) Report. No Obligations. No Credit Card.
Gordon T Long is not a registered advisor and does not give investment advice. His comments are an expression of opinion only and should not be construed in any manner whatsoever as recommendations to buy or sell a stock, option, future, bond, commodity or any other financial instrument at any time. While he believes his statements to be true, they always depend on the reliability of his own credible sources. Of course, he recommends that you consult with a qualified investment advisor, one licensed by appropriate regulatory agencies in your legal jurisdiction, before making any investment decisions, and barring that you are encouraged to confirm the facts on your own before making important investment commitments. © Copyright 2013 Gordon T Long. The information herein was obtained from sources which Mr. Long believes reliable, but he does not guarantee its accuracy. None of the information, advertisements, website links, or any opinions expressed constitutes a solicitation of the purchase or sale of any securities or commodities. Please note that Mr. Long may already have invested or may from time to time invest in securities that are recommended or otherwise covered on this website. Mr. Long does not intend to disclose the extent of any current holdings or future transactions with respect to any particular security. You should consider this possibility before investing in any security based upon statements and information contained in any report, post, comment or suggestions you receive from him.
Copyright © 2010-2018 Gordon T. Long
Gordon T Long Archive |
© 2005-2022 http://www.MarketOracle.co.uk - The Market Oracle is a FREE Daily Financial Markets Analysis & Forecasting online publication.


