


Focus on the Stock Market’s Price Action and Ignore the Failed Hindenburg Omen
Stock-Markets / Stock Markets 2018 Sep 25, 2018 - 10:53 AM GMTBy: Troy_Bombardia

 Our recent quantitative market studies have shown an interesting divergence:
- The U.S. stock market’s own price action suggests that the stock market will continue to rally for another year.
- Various studies of the stock market’s breadth have been bearish. They’ve pointed to a “bear market” or “big correction” very soon. Some of these have been the Hindenburg Omen.
So which of these 2 market studies is right? Which is more important? Price action or breadth?
As U.S. stock market investors and traders, our job is to separate the signal from the noise.
As always, the economy’s fundamentals determine the stock market’s medium-long term outlook. Technicals determine the stock market’s short-medium term outlook. Here’s why:
- The stock market’s long term is bullish.
- The stock market’s medium term is bullish.
- The stock market’s short term is 50-50
Let’s go from the long term, to the medium term, to the short term.
Long Term
The Medium-Long Term Model remains bullish on the U.S. stock market.
Since the economy and stock market move in the same direction in the long term, leading economic indicators are also leading stocks market indicators.
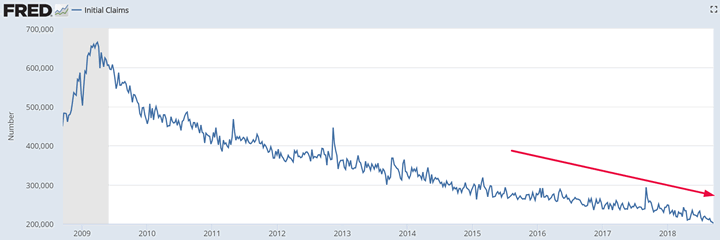
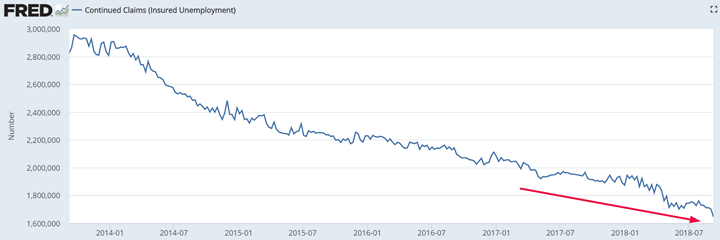
Leading U.S. economic indicators continue to improve, which suggests that the bull market in U.S. stocks isn’t over.
Initial Claims and Continued Claims continue to make new lows for this economic expansion.
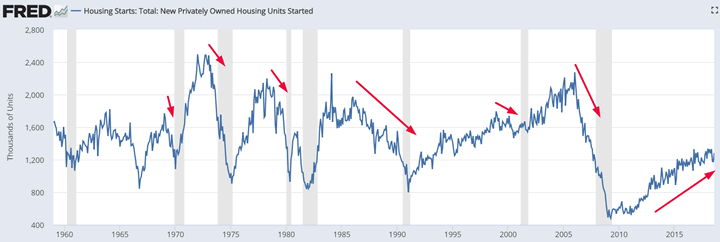
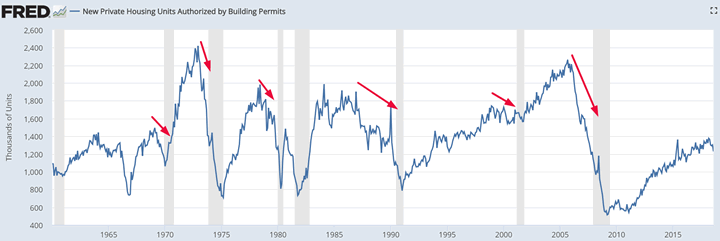
While Housing Starts & Building Permits have fallen a little recently, the main trend is still upwards.
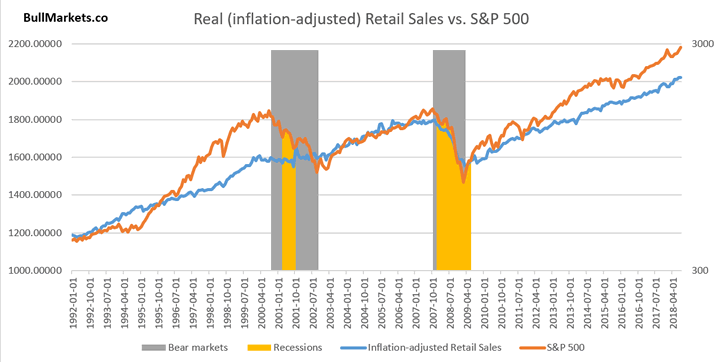
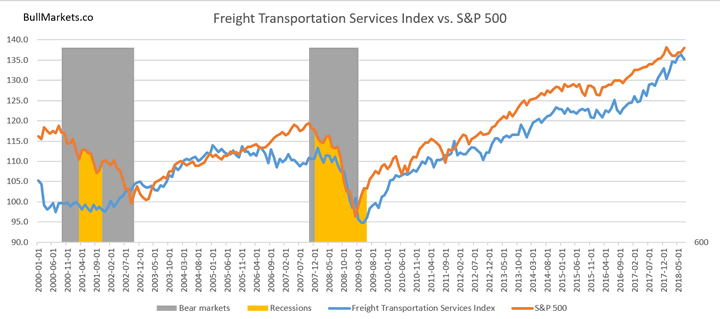
Meanwhile, Freight Transportation Services and inflation-adjusted Retail Sales continue to trend upwards.
Medium term
The stock market’s own price action is bullish while breadth has become bearish (e.g. Hindenburg Omen).
For starters, the stock market has rallied in a slow and steady manner. This usually results in a continuation of the uptrend.
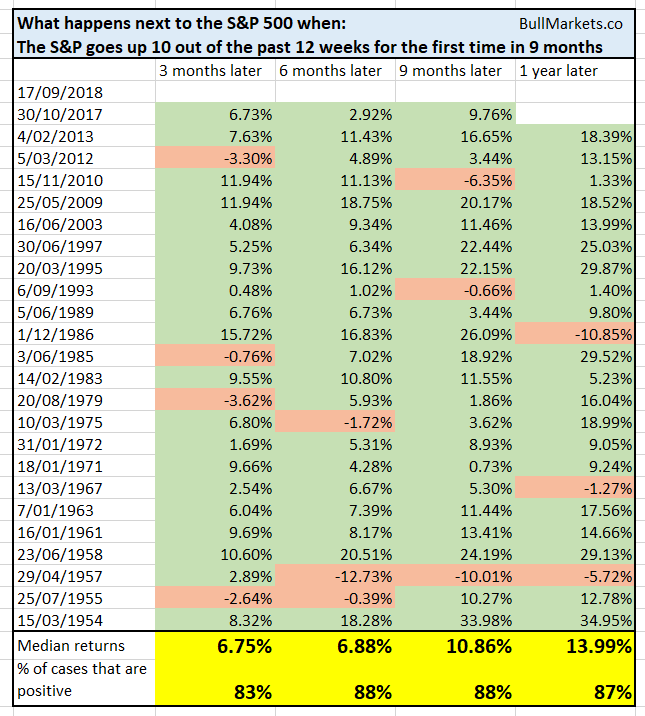
The stock market has been pretty strong this September. Historically, this is bullish for the S&P and Dow.
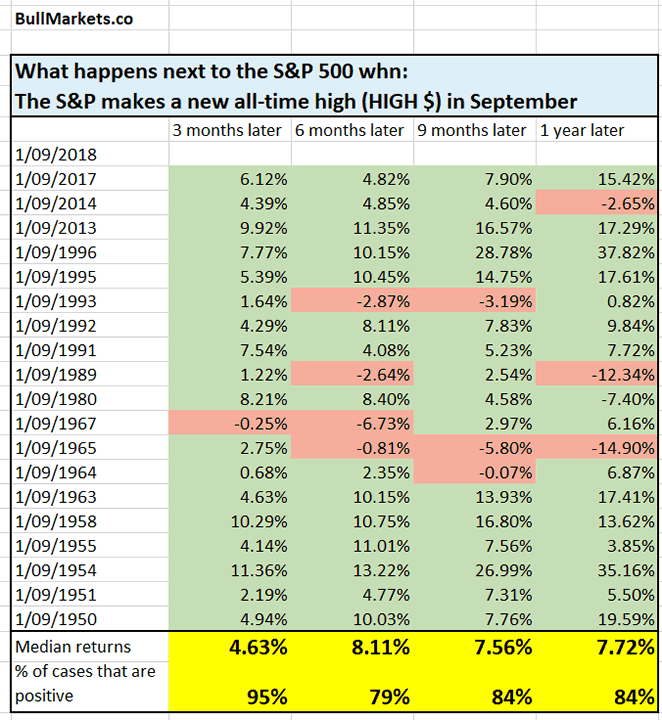
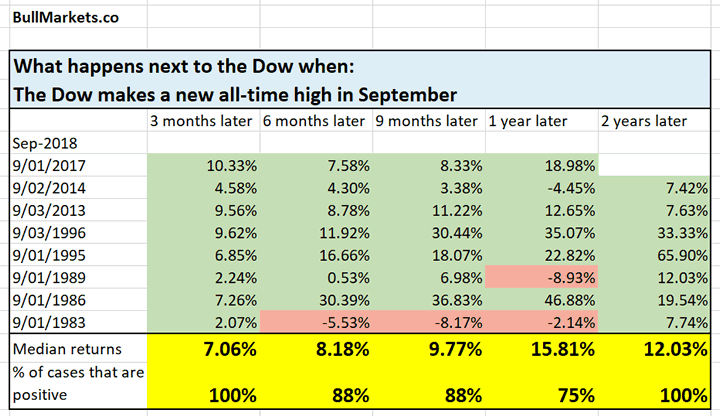
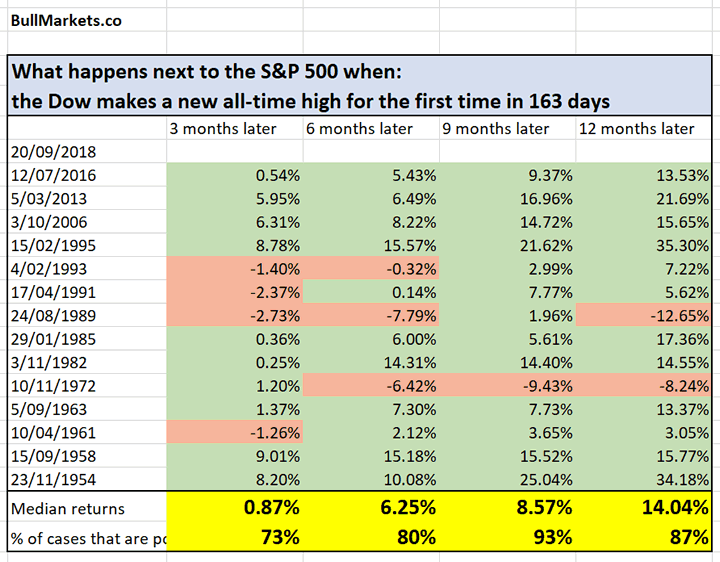
Moreover, the Dow finally broke out to a new all-time high. When this happens, the U.S. stock market (S&P 500) usually keeps going up.
The U.S. stock market is currently experiencing sector rotation. Large caps lagged during the first half of this year while small caps and tech led. Now large caps are leading.
Historically, this means that the stock market will either soar or crash over the next 1-2 years. There is no middle ground.
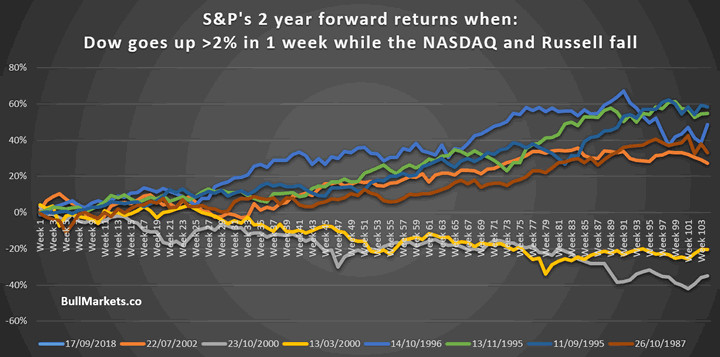
So as you can see, the U.S. stock market’s own price action points to continued gains over the next 6-12 months. However, the stock market is likely to trend higher while volatility increases as well.
The stock market’s bearish factors mostly come from breadth indicators (e.g. the Hindenburg Omen).
Why price action is more important than breadth (e.g. Hindenburg Omen)
Traders tend to focus too much on breadth confirmation. Historically, bearish breadth divergences can last for YEARS before the stock market actually makes a big decline. Using these breadth indicators is no better than a 50-50 coin toss.
One of the biggest bearish worries recently has been the Hindenburg Omen.
Last week there was a cluster of Hindenburg Omens that before had only happened in:
- 2014
- 1999
- 1990
Sounds bearish, doesn’t this?
In reality, clusters of Hindenburg Omens have occurred repeatedly (and failed repeatedly) in the past.
Failed Hindenburg Omens: December 12, 2016
There were 3 Hindenburg Omens in 3 weeks. Before, this had only happened in:
- April 1972
- February 1980
- October 1995
- December 1997
- December 1999
- April 2006
- July 2007
- January 2015
Sounds bearish, doesn’t this? These historical signals occurred before a lot of major declines.
Fact: the stock market soared after December 2016. FAILED cluster of Hindenburg Omens.
Failed Hindenburg Omens: July 31, 2017
There were 8 Hindenburg Omens in 30 days. Before, this had only happened in:
- 1990
- 1993
- 1999
- 2007
*The S&P made a “big correction” or bear market after all of these historical cases.
Sounds bearish, doesn’t this? These historical signals occurred before a lot of major declines.
Fact: the stock market soared after July 2017. FAILED cluster of Hindenburg Omens.
Failed Hindenburg Omens: August 16, 2017
There were 8 Hindenburg Omens in 30 days. Before, this had only happened in:
- 1990
- 1999/2000
- 2007
*The S&P made a “big correction” or bear market after all of these historical cases.
Sounds bearish, doesn’t this? These historical signals occurred before a lot of major declines.
Fact: the stock market soared after August 2017. FAILED cluster of Hindenburg Omens.
Failed Hindenburg Omens: November 15, 2017
There was a major cluster of Hindenburg Omens while >30% of stocks were below their 200 dma. Before, this had only happened in:
- July 1998
- December 1999
- July 2007
*The S&P made a “big correction” or bear market after all of these historical cases.
Sounds bearish, doesn’t this? These historical signals occurred before a lot of major declines.
Fact: the stock market rallied after November 2017. FAILED cluster of Hindenburg Omens.
Need I continue? So why do breadth indicators like the Hindenburg Omen have so many false bearish signals?
- The Hindenburg Omen uses NYSE data. The NYSE has a lot of FOREIGN stocks. This does not accurately reflect the U.S. stock market. Divergences increasingly only reflect a divergence between U.S. and non-U.S. stocks.
- The Hindenburg Omen looks for >2.8% of stocks making 52 week highs and 52 week lows. 2.8% is a TINY number. It’s not saying that e.g. “30% of stocks are making 52 week highs and 30% of stocks are making 52 week lows”.
From what I’ve seen over the years, the stock market’s own price action is more important than breadth.
And lastly, Bank of America’s latest fund manager demonstrates that fund managers are the most pessimistic on the global economy since 2011.
Considering that only 10% of active fund managers outperform the S&P 500, this is a bullish sign for U.S. stocks. Active fund managers are mostly a contrarian indicator.
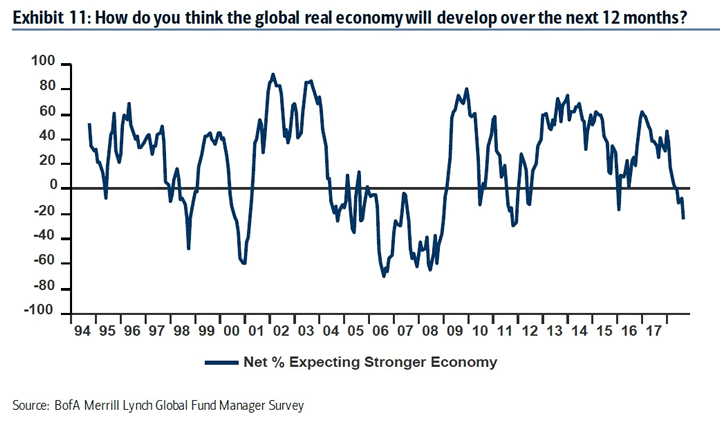
As you can see in the above chart, this level of bearishness DURING AN ECONOMIC EXPANSION (e.g. 1998, 2004-2006, 2011, 2016) marks a medium term buying opportunity. And with U.S. economic growth at 3-4%, a recession over the next 6-12 months is highly unlikely.
Conclusion
The stock market’s medium term outlook remains bullish. The long term is still bullish, but we are watching out for deterioration in the economic data (which has not happened yet).
Focus on the stock market’s own price action instead of breadth. Breadth indicators are of secondary importance.
The short term is mostly a 50-50 bet.
Click here for more market studies.
By Troy Bombardia
I’m Troy Bombardia, the author behind BullMarkets.co. I used to run a hedge fund, but closed it due to a major health scare. I am now enjoying life and simply investing/trading my own account. I focus on long term performance and ignore short term performance.
Copyright 2018 © Troy Bombardia - All Rights Reserved
Disclaimer: The above is a matter of opinion provided for general information purposes only and is not intended as investment advice. Information and analysis above are derived from sources and utilising methods believed to be reliable, but we cannot accept responsibility for any losses you may incur as a result of this analysis. Individuals should consult with their personal financial advisors.
© 2005-2022 http://www.MarketOracle.co.uk - The Market Oracle is a FREE Daily Financial Markets Analysis & Forecasting online publication.